Fig. 3.
Download original image
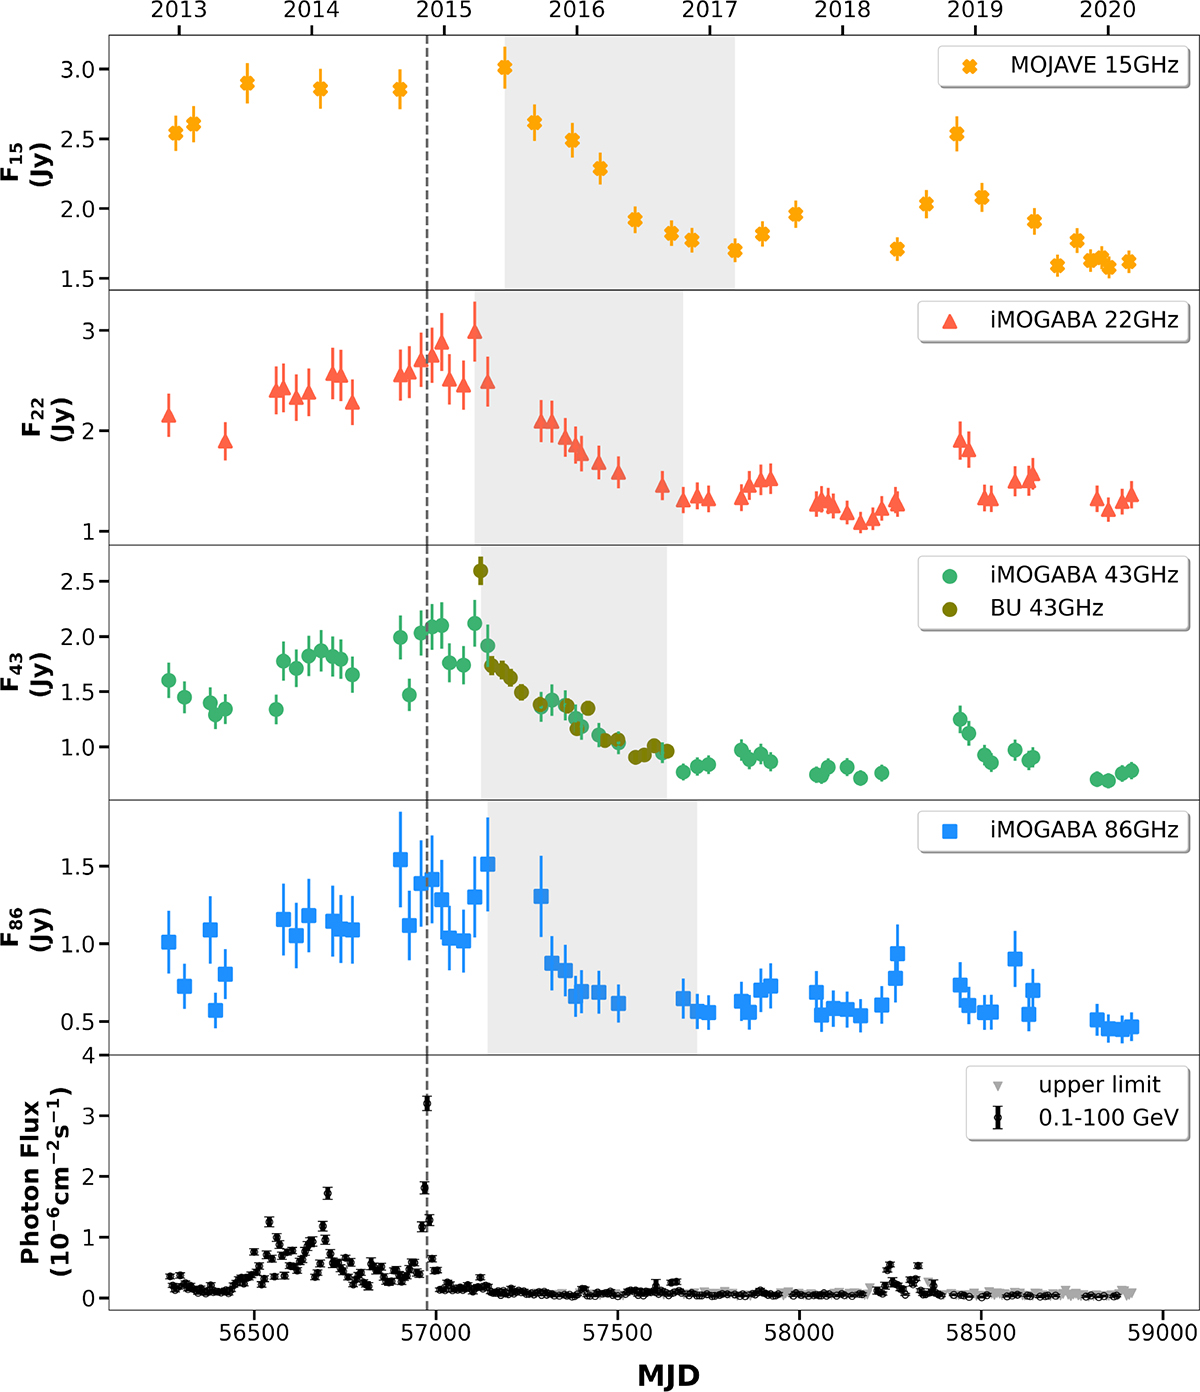
Light curves of PKS 1222+216 observed from December 2012 to March 2020 (MJD 56265–58914) at 15, 22, 43, and 86 GHz. The total CLEAN flux densities are shown for each frequency. In the third panel, the green circles represent the iMOGABA data, while the olive circles correspond to the BU data. The error bars used typical values of 10% for K and Q, and 20% for W. BU and MOJAVE were applied at 5% (Jorstad et al. 2017). The bottom panel shows the 0.1–100 GeV γ-ray light curve from the Fermi-LAT LCR. The upper limit of the flux density is indicated by the gray triangles. The gray vertical dashed line refers to the γ-ray peak at MJD 56975.5 (Ezhikode et al. 2022). The gray boxes are the periods that fit the exponential decay profiles at each frequency.
Current usage metrics show cumulative count of Article Views (full-text article views including HTML views, PDF and ePub downloads, according to the available data) and Abstracts Views on Vision4Press platform.
Data correspond to usage on the plateform after 2015. The current usage metrics is available 48-96 hours after online publication and is updated daily on week days.
Initial download of the metrics may take a while.