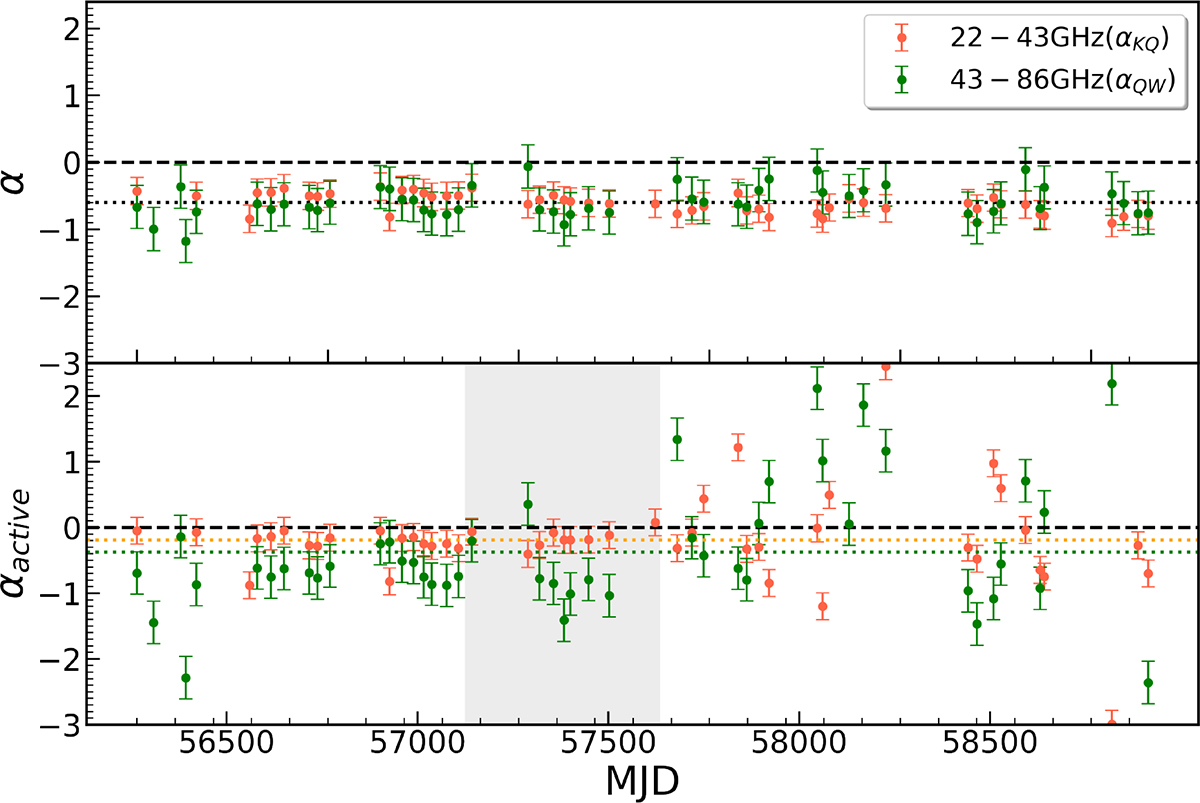
Fig. 4.
Download original image
Radio spectral indices at 22–43 GHz and 43–86 GHz. The top panel represents the values derived from the CLEAN total flux, while the bottom panel corresponds to the active flux. The orange scatters represent the spectral index at 22–43 GHz, while the green scatters indicate the spectral index at 43–86 GHz. The horizontal dashed line indicates that the spectral index is zero, and the dotted line in the top panel is the mean value with α = −0.6. In the bottom panel, the orange dotted line represents the average active spectral index of −0.19 at 22–43 GHz, while the green dotted line represents the average active spectral index of −0.37 at 43–86 GHz. The gray box indicates the decreasing period from 57124 to 57636 at 43 GHz.
Current usage metrics show cumulative count of Article Views (full-text article views including HTML views, PDF and ePub downloads, according to the available data) and Abstracts Views on Vision4Press platform.
Data correspond to usage on the plateform after 2015. The current usage metrics is available 48-96 hours after online publication and is updated daily on week days.
Initial download of the metrics may take a while.