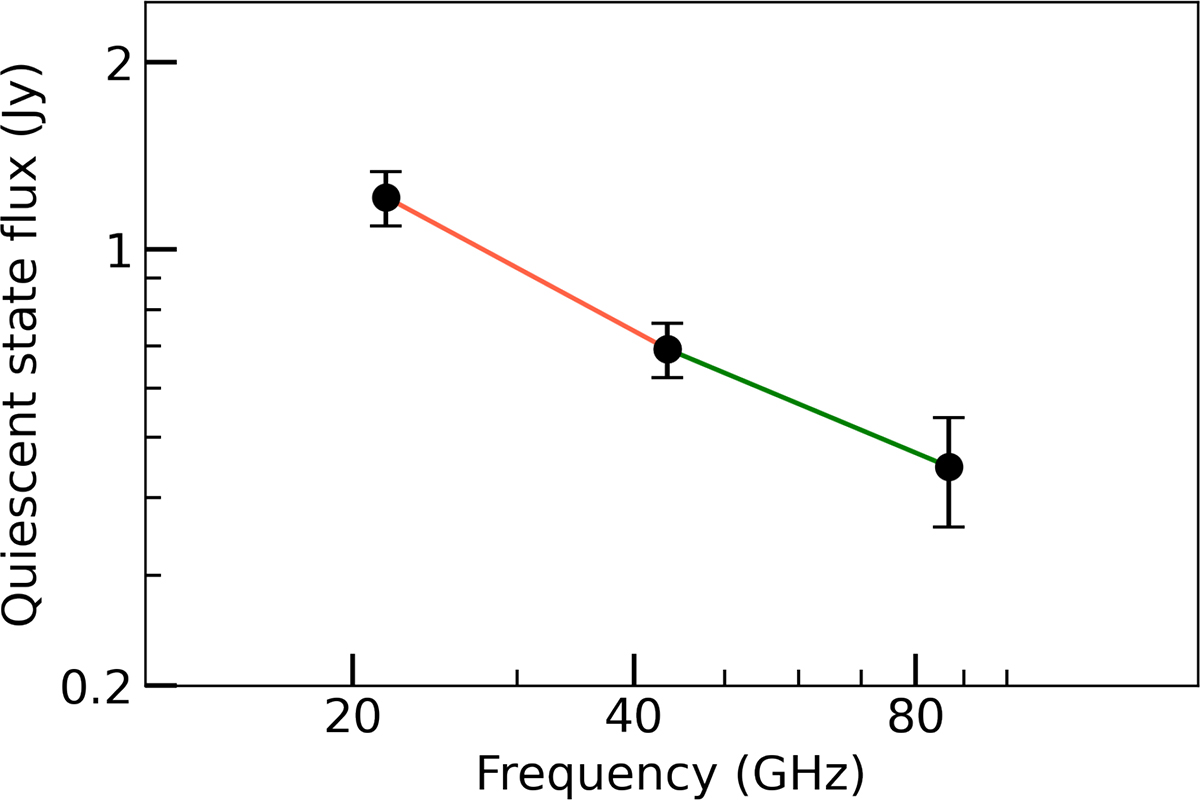
Fig. 5.
Download original image
Spectral index of PKS 1222+216 in the quiescent state. The black points represent the quiescent-state flux densities at 22, 43, and 86 GHz, with error bars indicating flux uncertainties. The orange slope corresponds to the quiescent spectral index between 22 and 43 GHz (αKQ = −0.81), while the green slope represents the quiescent spectral index between 43 and 86 GHz (αQW = −0.628).
Current usage metrics show cumulative count of Article Views (full-text article views including HTML views, PDF and ePub downloads, according to the available data) and Abstracts Views on Vision4Press platform.
Data correspond to usage on the plateform after 2015. The current usage metrics is available 48-96 hours after online publication and is updated daily on week days.
Initial download of the metrics may take a while.