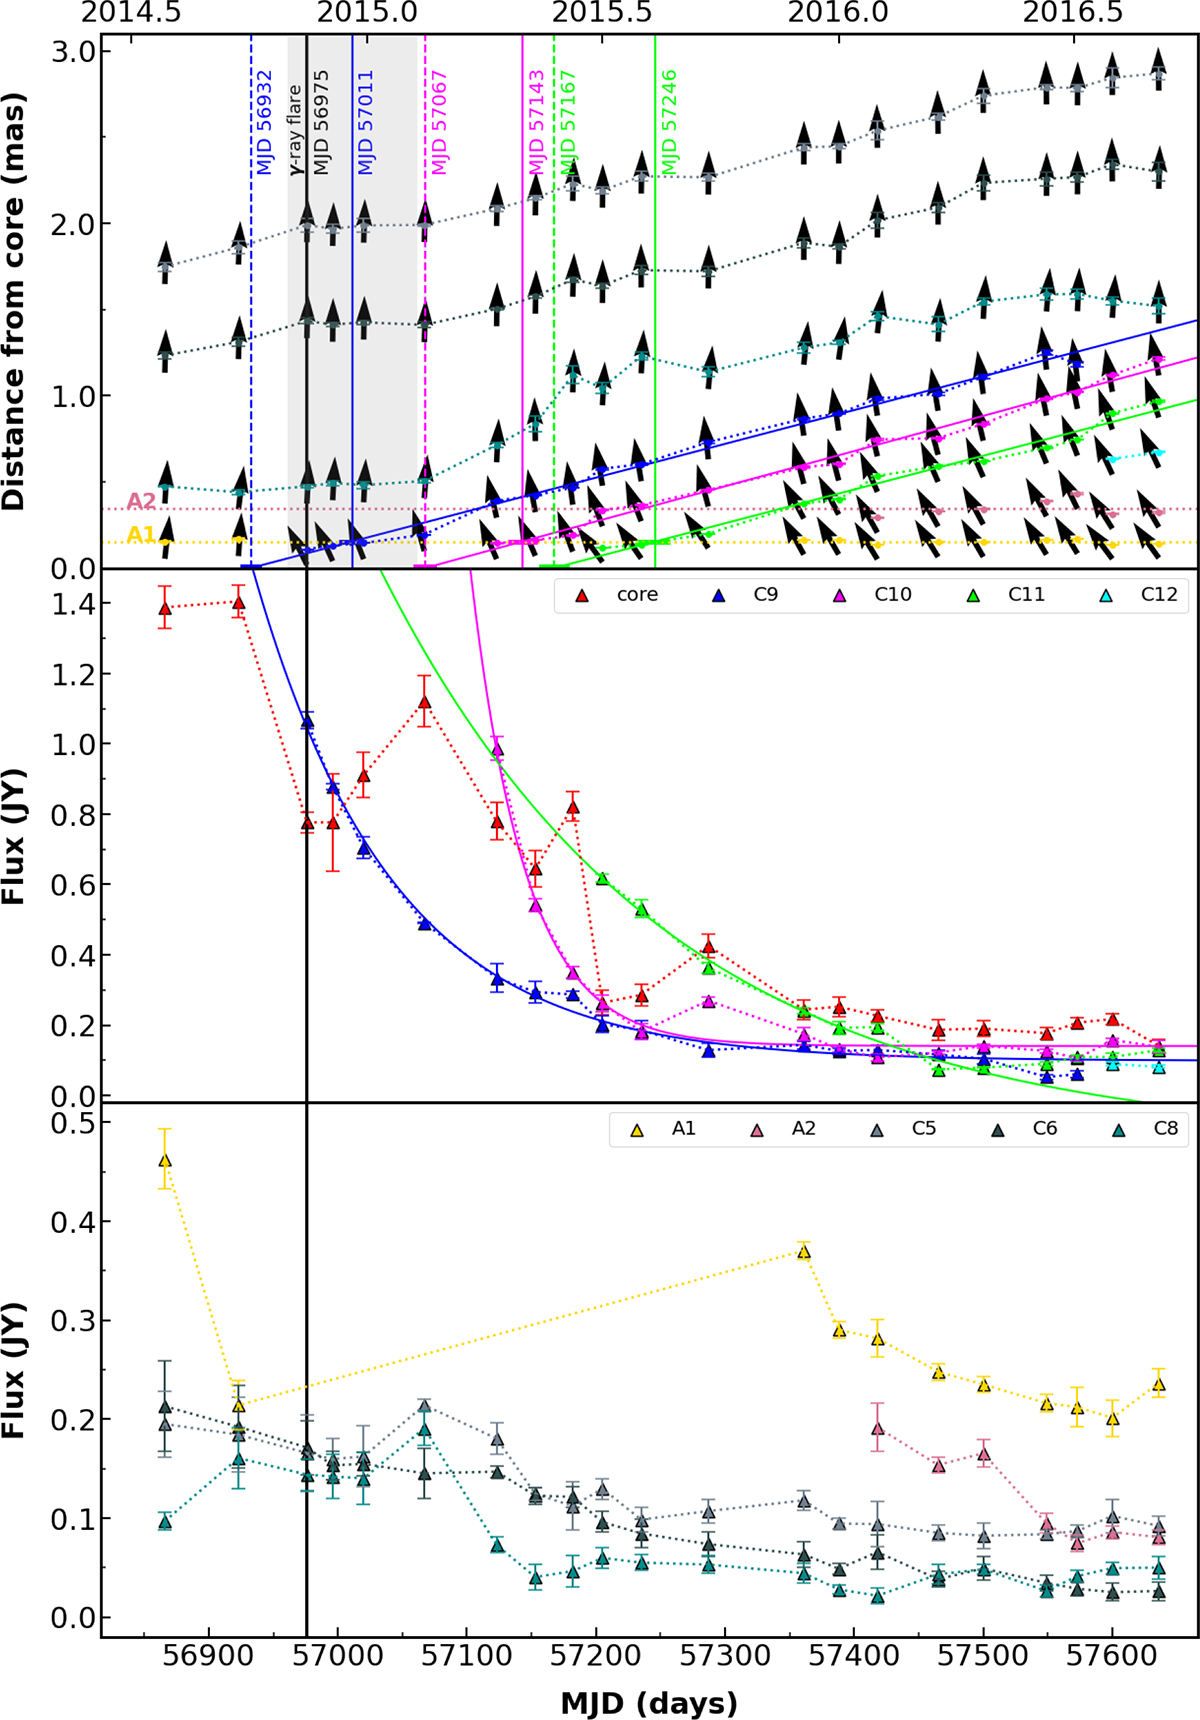
Fig. 6.
Download original image
Upper panel: Radial distance of 43 GHz jet components relative to the core, which is shifted to the phase center at (0,0) position, from April 2015 to September 2016. The black arrows represent their position angles, and the solid lines represent their fitted trajectories. The colors correspond to the newly ejected components: C9 (blue), C10 (magenta), C11 (green), and C12 (cyan). The gray box highlights the interaction period between components C9 and A1. The horizontal yellow and pink lines indicate the mean positions of stationary components A1 and A2, respectively. Middle panel: Flux density of the core (red) and the newly ejected components, C9, C10, C11, and C12. Bottom panel: Flux density of components with relatively low flux density: C5, C6, C8, C12, A1, and A2. The black vertical line at MJD 56975 represents the epoch of the γ-ray flare.
Current usage metrics show cumulative count of Article Views (full-text article views including HTML views, PDF and ePub downloads, according to the available data) and Abstracts Views on Vision4Press platform.
Data correspond to usage on the plateform after 2015. The current usage metrics is available 48-96 hours after online publication and is updated daily on week days.
Initial download of the metrics may take a while.