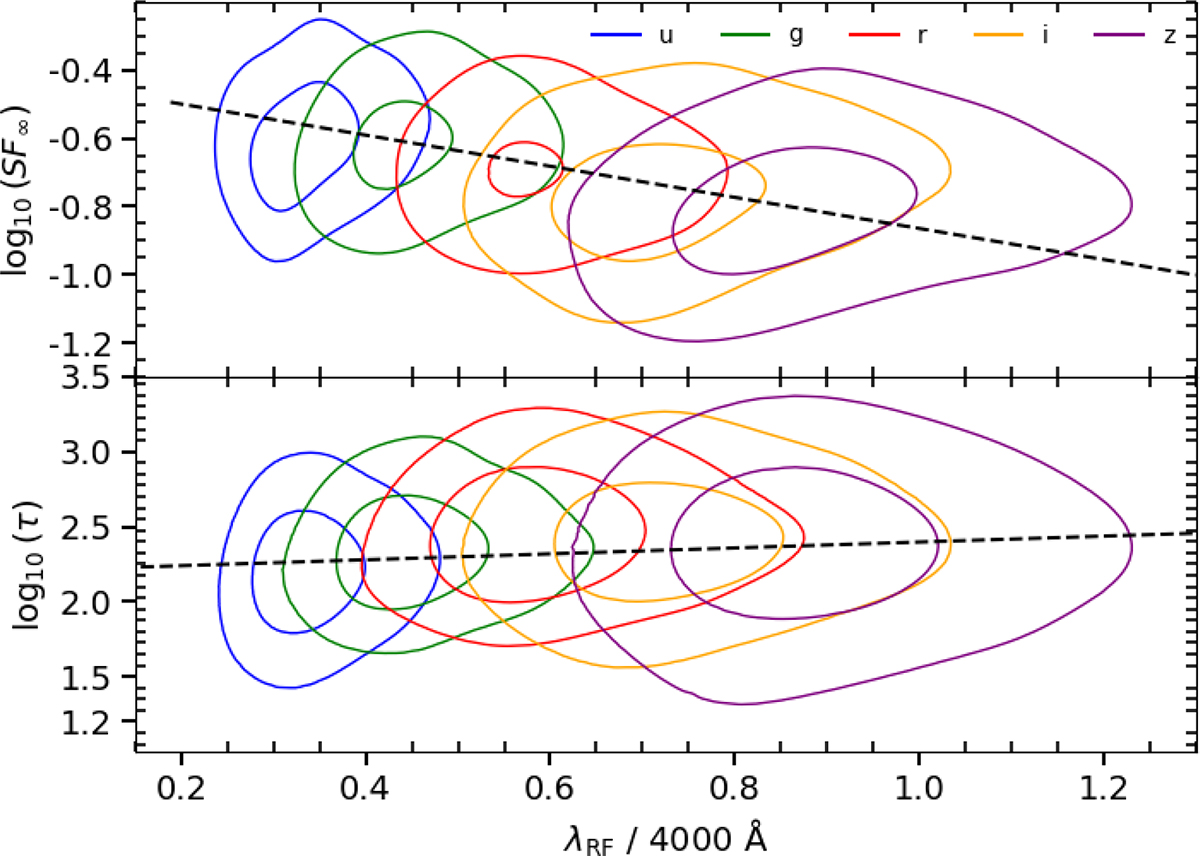
Fig. 2.
Download original image
Distribution of the variability parameters, SF∞ and τ, in the observed frame, measured from the ugriz bands as a function of rest frame wavelength. The coefficients of the Eq. (3) are calculated by fitting these values, corresponding to both the amplitude and timescale of variability. The dotted line represents the linear fit with slopes −0.456 and 0.19 for SF∞ and τ, respectively.
Current usage metrics show cumulative count of Article Views (full-text article views including HTML views, PDF and ePub downloads, according to the available data) and Abstracts Views on Vision4Press platform.
Data correspond to usage on the plateform after 2015. The current usage metrics is available 48-96 hours after online publication and is updated daily on week days.
Initial download of the metrics may take a while.