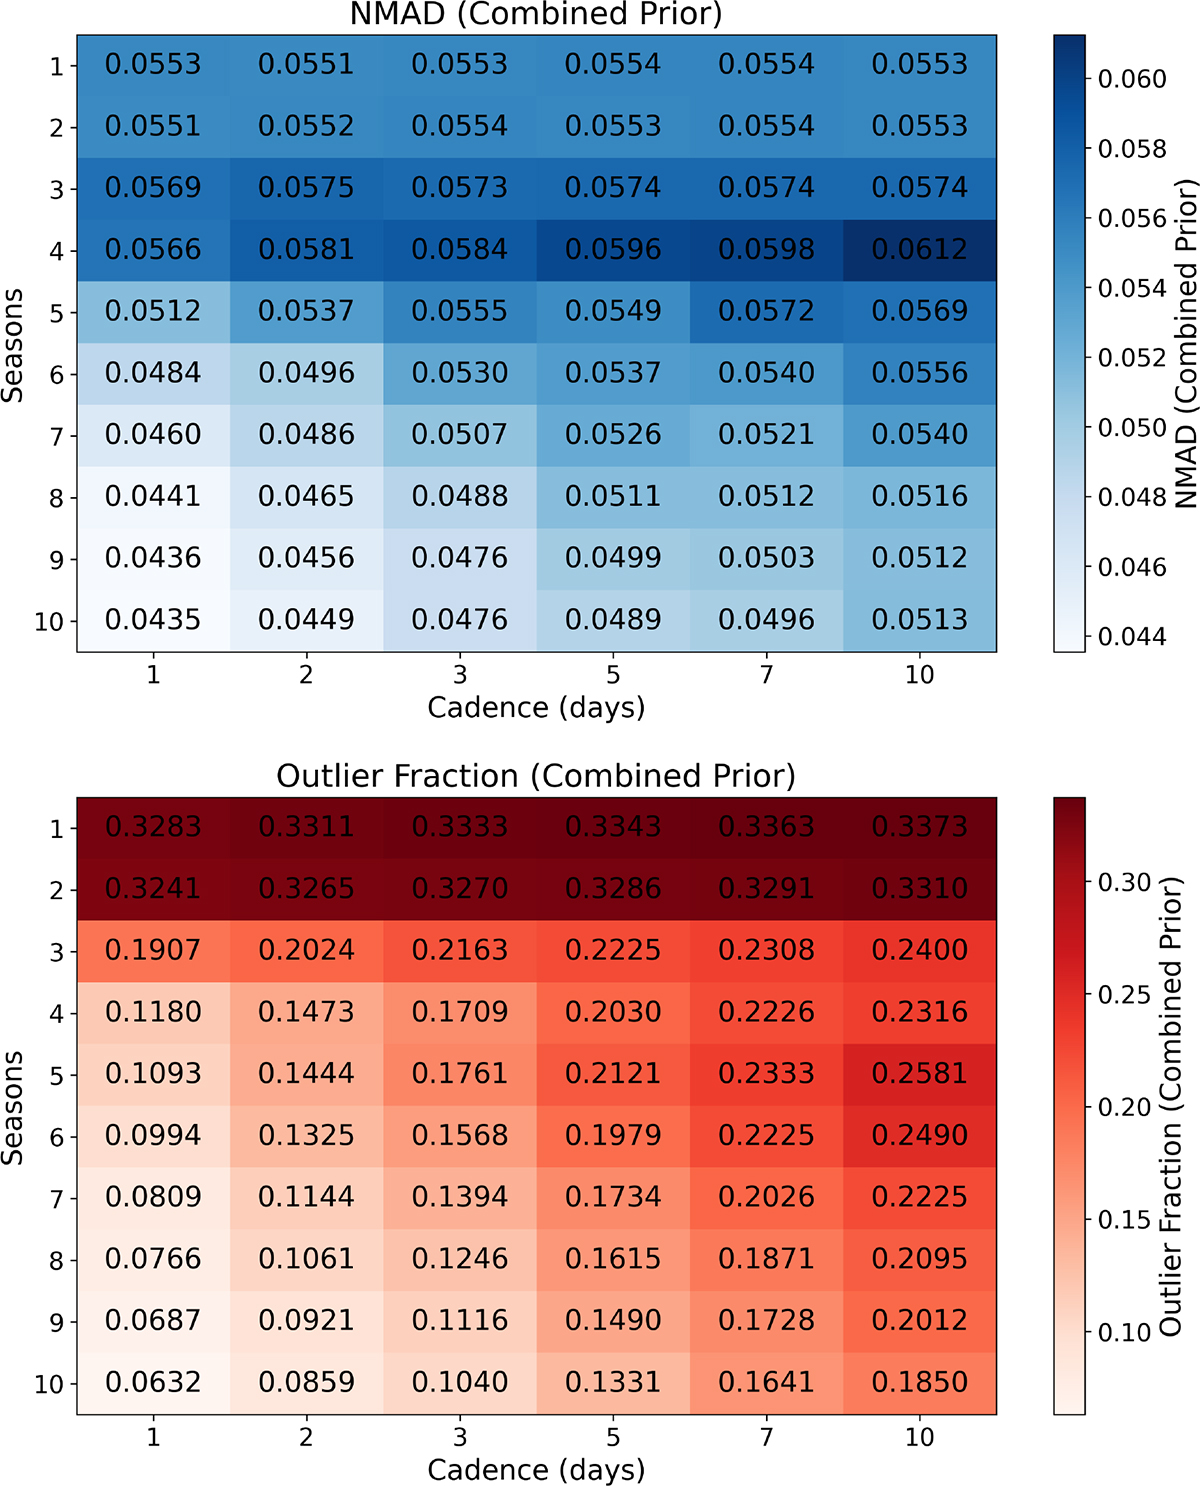
Fig. 4.
Download original image
Heatmap illustrating the influence of observational cadence and baseline length (in SDSS seasons) on photometric redshift estimation metrics: the NMAD (top) as a measure of precision, and the outlier fraction (bottom). The color bar, presented on a logarithmic scale, maps these metrics such that regions depicting lower values correspond to the most promising observing conditions, yielding higher precision and a reduced fraction of outliers in photometric redshift predictions.
Current usage metrics show cumulative count of Article Views (full-text article views including HTML views, PDF and ePub downloads, according to the available data) and Abstracts Views on Vision4Press platform.
Data correspond to usage on the plateform after 2015. The current usage metrics is available 48-96 hours after online publication and is updated daily on week days.
Initial download of the metrics may take a while.