Fig. 5.
Download original image
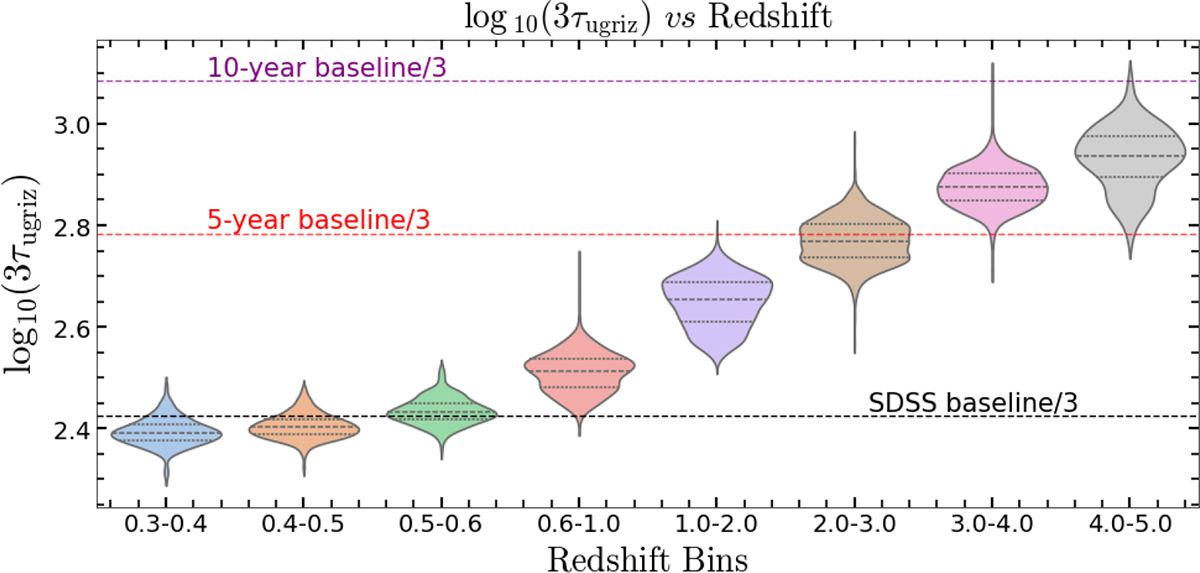
Violin plot showing the median AGN variability timescale (τ) estimated from M10 over the SDSS bands as a function of redshift. The dashed black line represents one-third of the SDSS baseline duration, showing the redshift-dependent threshold beyond which the condition 3τ < baseline is no longer satisfied. This requirement defines the redshift range over which VAR-PZ can constrain redshifts with the current data. The red and purple line represent one-third of the 5 and 10 year LSST baseline, respectively. LSST’s enhanced sensitivity will enable the detection of fainter objects, resulting in lower overall timescale values (τ) and consequently providing greater constraining power.
Current usage metrics show cumulative count of Article Views (full-text article views including HTML views, PDF and ePub downloads, according to the available data) and Abstracts Views on Vision4Press platform.
Data correspond to usage on the plateform after 2015. The current usage metrics is available 48-96 hours after online publication and is updated daily on week days.
Initial download of the metrics may take a while.