Fig. 8.
Download original image
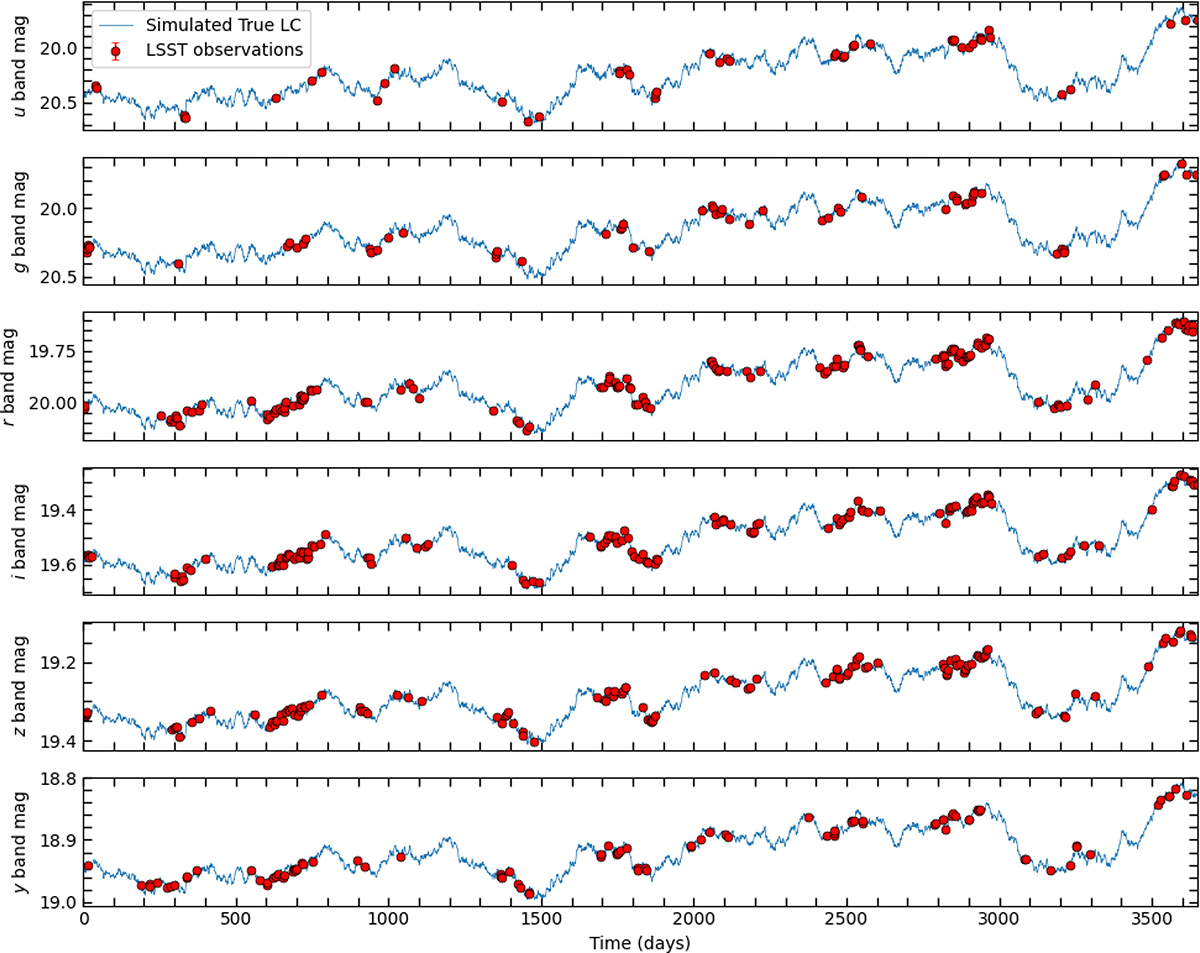
Simulated LSST light curve for a source using DRW parameters fit (SDSS J000008.13+001634.6, z = 1.836), as observed under the LSST Wide-Fast-Deep (WFD) survey strategy over the 10-year baseline. The underlying blue curve represents the light curve sampled with a uniform 1-day cadence. Overlaid red points correspond to LSST observations in all six bands (ugrizy), incorporating realistic survey cadence and photometric uncertainties based on the LSST observing strategy.
Current usage metrics show cumulative count of Article Views (full-text article views including HTML views, PDF and ePub downloads, according to the available data) and Abstracts Views on Vision4Press platform.
Data correspond to usage on the plateform after 2015. The current usage metrics is available 48-96 hours after online publication and is updated daily on week days.
Initial download of the metrics may take a while.