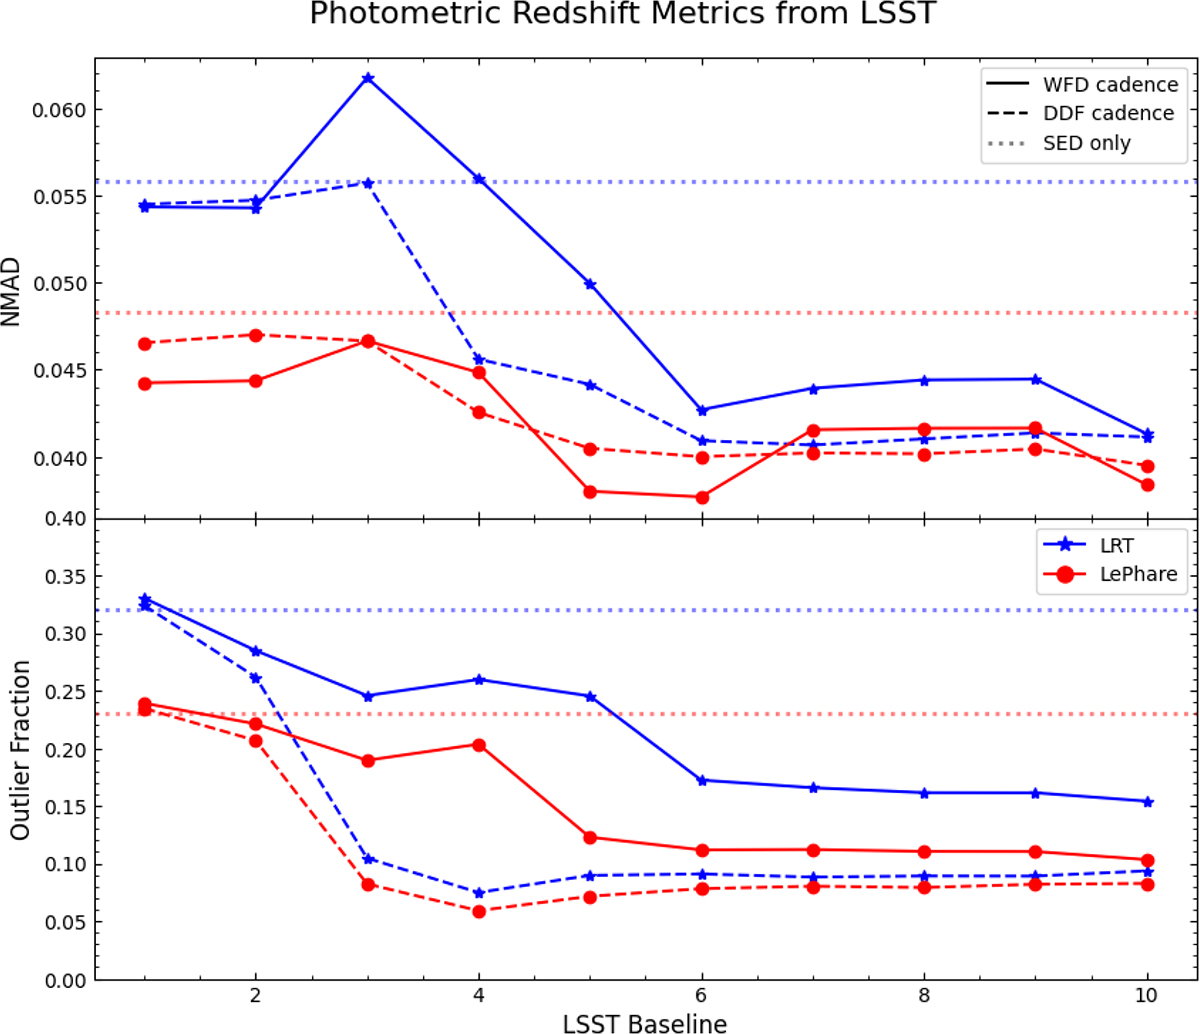
Fig. 9.
Download original image
Evolution of photo-z precision and outlier fraction for our parent sample as a function of the LSST temporal baseline. The panels also include a comparison with the results obtained using the LSST DDF cadence. This figure illustrates the improvements achieved by incorporating the VAR-PZ variability priors into both the LRT and LePHARE SED fitting routines, highlighting the impact on two independent methods. The LePHARE SED fitting is performed using the Sloan ugriz filters, whereas both LRT and VAR-PZ utilize synthetic LSST ugrizy filters.
Current usage metrics show cumulative count of Article Views (full-text article views including HTML views, PDF and ePub downloads, according to the available data) and Abstracts Views on Vision4Press platform.
Data correspond to usage on the plateform after 2015. The current usage metrics is available 48-96 hours after online publication and is updated daily on week days.
Initial download of the metrics may take a while.