Open Access
Fig. A.2
Download original image
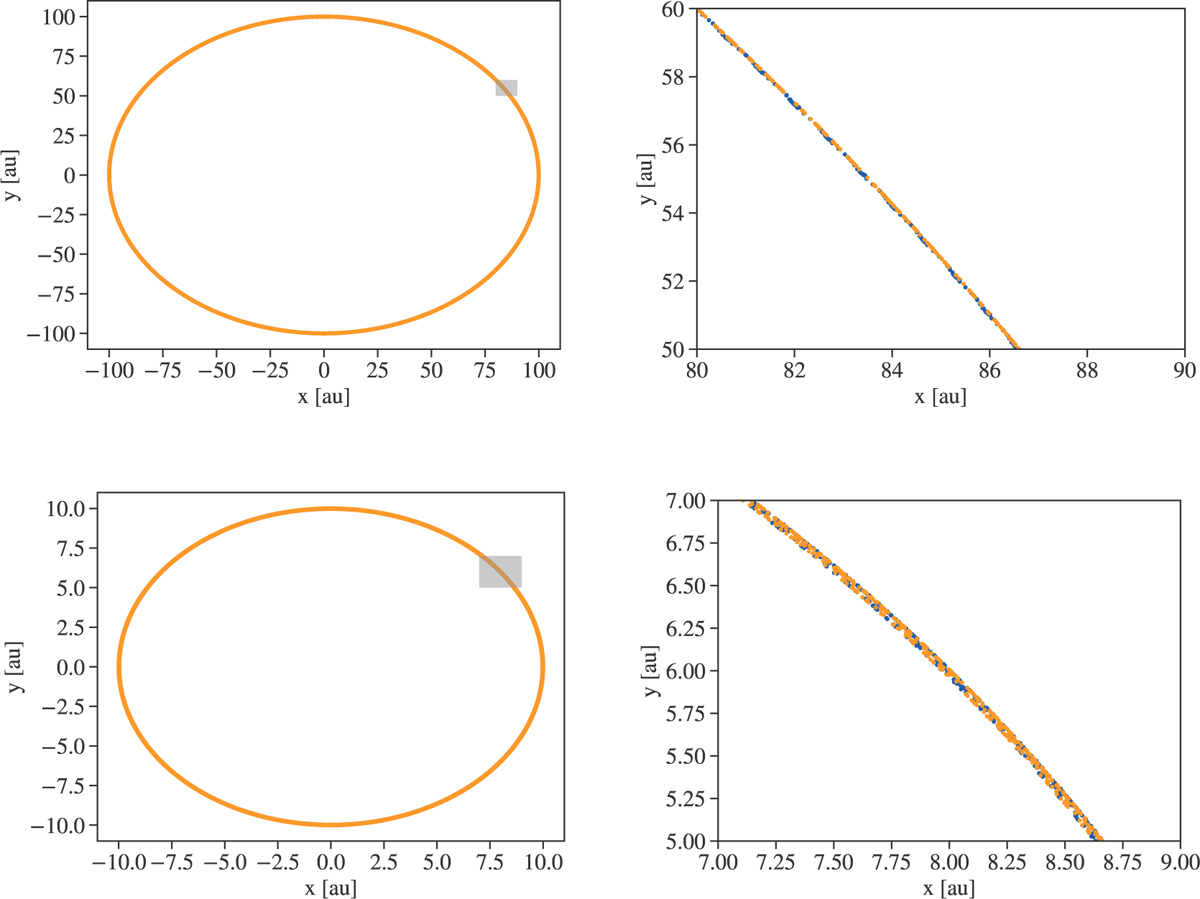
Pure three-body simulations: secondary star’s (top panels) and planet’s (bottom panels) orbit on the x-y plane. Right: Zoomed-in region that is highlighted in gray in the left panels. The simulation run with our code is displayed with an orange color, while the simulation run with the DPI library are in blue.
Current usage metrics show cumulative count of Article Views (full-text article views including HTML views, PDF and ePub downloads, according to the available data) and Abstracts Views on Vision4Press platform.
Data correspond to usage on the plateform after 2015. The current usage metrics is available 48-96 hours after online publication and is updated daily on week days.
Initial download of the metrics may take a while.