Fig. 3
Download original image
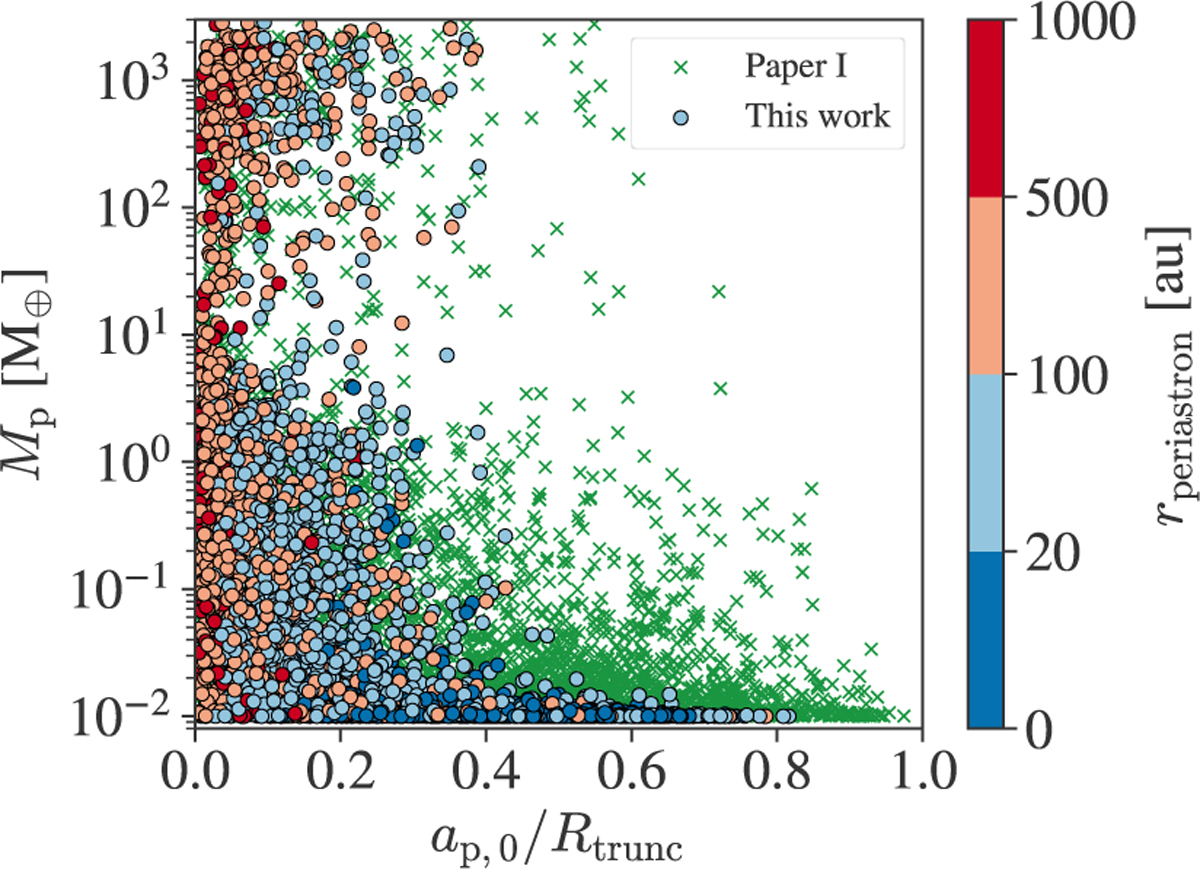
Simulation set A: initial planetary position relative to the disk truncation radius, ap,0/Rtrunc, versus the final planet mass. The color bar shows the binary periastron distance. Circle markers represent stable planets from our simulations (effect of disk truncation + gravitational perturbation inside the N-body integrator), while green crosses represent stable planets from Paper I simulations (effect of disk truncation only).
Current usage metrics show cumulative count of Article Views (full-text article views including HTML views, PDF and ePub downloads, according to the available data) and Abstracts Views on Vision4Press platform.
Data correspond to usage on the plateform after 2015. The current usage metrics is available 48-96 hours after online publication and is updated daily on week days.
Initial download of the metrics may take a while.