Fig. 7
Download original image
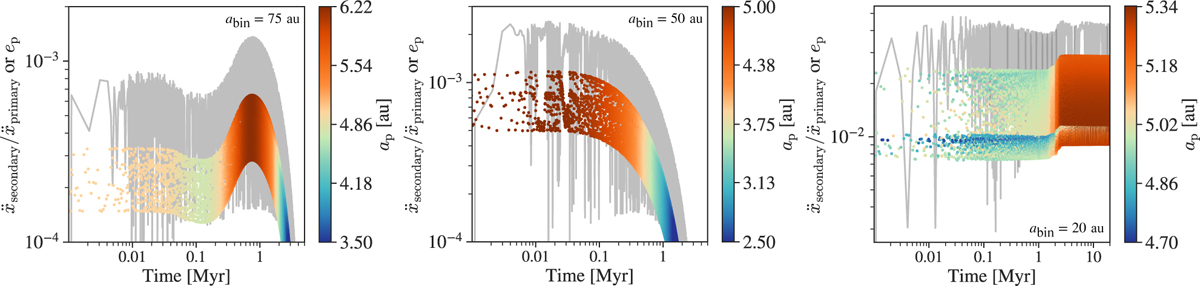
Simulation set B (with migration): time evolution of the planet’s acceleration due to the secondary star (![]() ) normalized by the acceleration due to the primary star (
) normalized by the acceleration due to the primary star (![]() ), color-coded by planet semimajor axis. The gray line represents the planet’s eccentricity. Each panel corresponds to a specific binary case: abin = 75 au (left panel), abin = 50 au (middle panel), and abin = 20 au (right panel), with the embryo initially placed at 5 au. Note the different x-axis, y-axis and color bar scales for each plot.
), color-coded by planet semimajor axis. The gray line represents the planet’s eccentricity. Each panel corresponds to a specific binary case: abin = 75 au (left panel), abin = 50 au (middle panel), and abin = 20 au (right panel), with the embryo initially placed at 5 au. Note the different x-axis, y-axis and color bar scales for each plot.
Current usage metrics show cumulative count of Article Views (full-text article views including HTML views, PDF and ePub downloads, according to the available data) and Abstracts Views on Vision4Press platform.
Data correspond to usage on the plateform after 2015. The current usage metrics is available 48-96 hours after online publication and is updated daily on week days.
Initial download of the metrics may take a while.