Fig. 3.
Download original image
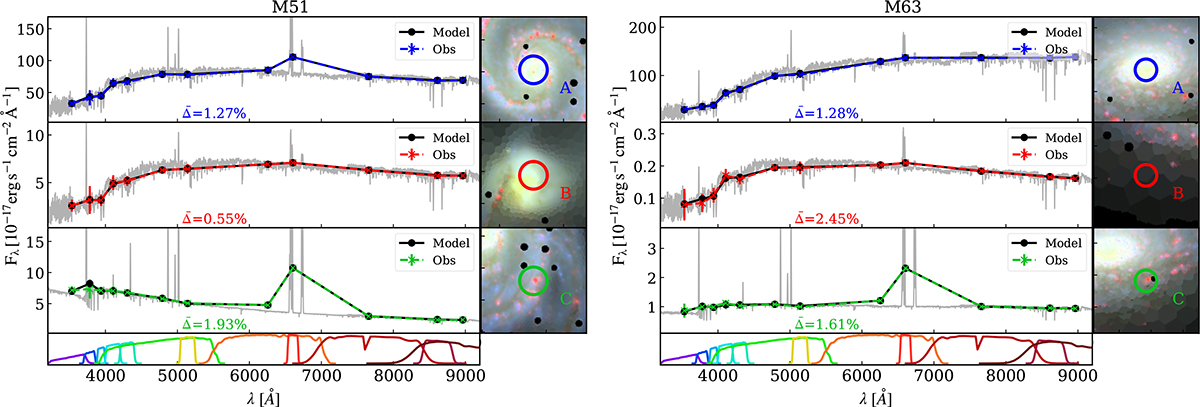
Example ALSTAR fits for individual spaxels in different regions of M51 and M63. Colored lines with error bars show the data (Oλ), while black lines show the model photometric fluxes (Mλ), and the gray lines show the corresponding high-resolution model spectrum. Images on the right show a 1.5′×1.5′ zoom of composites built with the J0660, r, and g fluxes in the R, G, and B channels, respectively. The bottom colored curves show the J-PLUS filter transmission curves.
Current usage metrics show cumulative count of Article Views (full-text article views including HTML views, PDF and ePub downloads, according to the available data) and Abstracts Views on Vision4Press platform.
Data correspond to usage on the plateform after 2015. The current usage metrics is available 48-96 hours after online publication and is updated daily on week days.
Initial download of the metrics may take a while.