Fig. 7.
Download original image
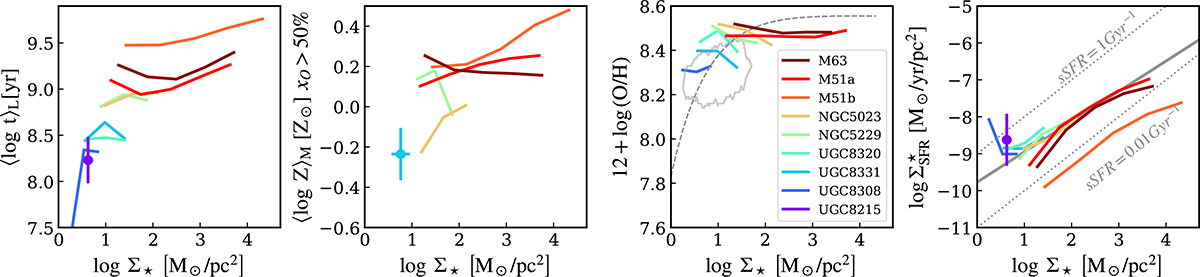
Median scaling relations for all galaxies. In the third column, the gray dashed line is the median curve from Barrera-Ballesteros et al. (2016) for 653 MaNGA galaxies. The gray line shows the 80% contour of Barrera-Ballesteros et al. (2016) for MaNGA galaxies with log M★/M⊙ < 9.2. The dotted lines in the last panel represent lines of specific SFR at 0.01 and 1 Gyr−1. The thick gray line shows the star-forming main sequence relation obtained by Enia et al. (2020) for nearby spirals. Where data are insufficient for a median curve, only uncertainty bars are plotted.
Current usage metrics show cumulative count of Article Views (full-text article views including HTML views, PDF and ePub downloads, according to the available data) and Abstracts Views on Vision4Press platform.
Data correspond to usage on the plateform after 2015. The current usage metrics is available 48-96 hours after online publication and is updated daily on week days.
Initial download of the metrics may take a while.