Fig. 5.
Download original image
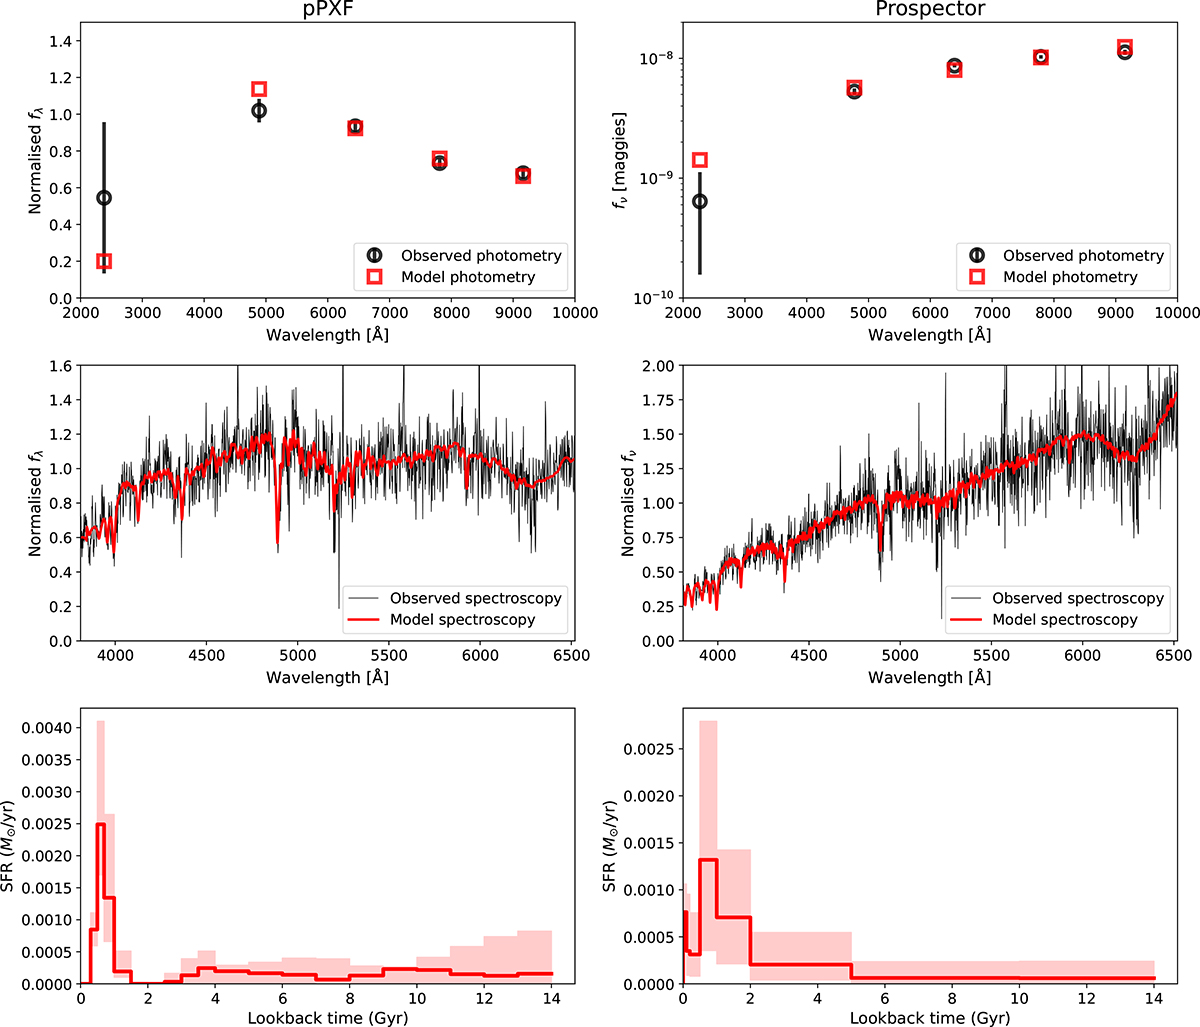
Stellar population modelling of the CSS, using independent codes pPXF (left column) and Prospector (right column). The top row shows SED fitting to the photometry, the middle row shows full spectral fitting where the spectra are normalised by the median flux, and the bottom row shows the inferred non-parametric star formation rate vs time. Qualitatively, both codes produce remarkably consistent results, with a very extended SFH that finished with a strong burst ∼1 Gyr ago.
Current usage metrics show cumulative count of Article Views (full-text article views including HTML views, PDF and ePub downloads, according to the available data) and Abstracts Views on Vision4Press platform.
Data correspond to usage on the plateform after 2015. The current usage metrics is available 48-96 hours after online publication and is updated daily on week days.
Initial download of the metrics may take a while.