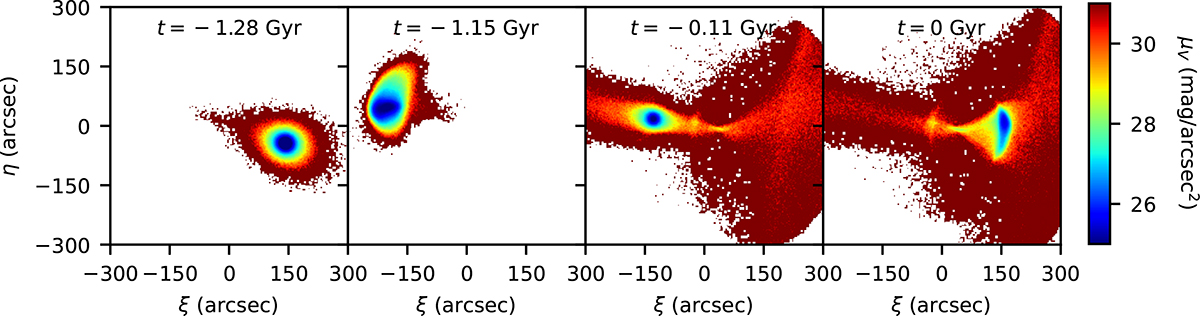
Fig. 8.
Download original image
Evolution of the N-body simulation that produces a shell similar to what is observed in NGC 7531. From left to right, the panels show the simulated dwarf 50 Myr before the first pericenter (t = −1.28 Gyr), 70 Myr after the first pericenter (t = −1.15 Gyr), 50 Myr before the second pericenter (t = −0.11 Gyr), and 60 Myr after the second pericenter (present day).
Current usage metrics show cumulative count of Article Views (full-text article views including HTML views, PDF and ePub downloads, according to the available data) and Abstracts Views on Vision4Press platform.
Data correspond to usage on the plateform after 2015. The current usage metrics is available 48-96 hours after online publication and is updated daily on week days.
Initial download of the metrics may take a while.