Open Access
Fig. 6
Download original image
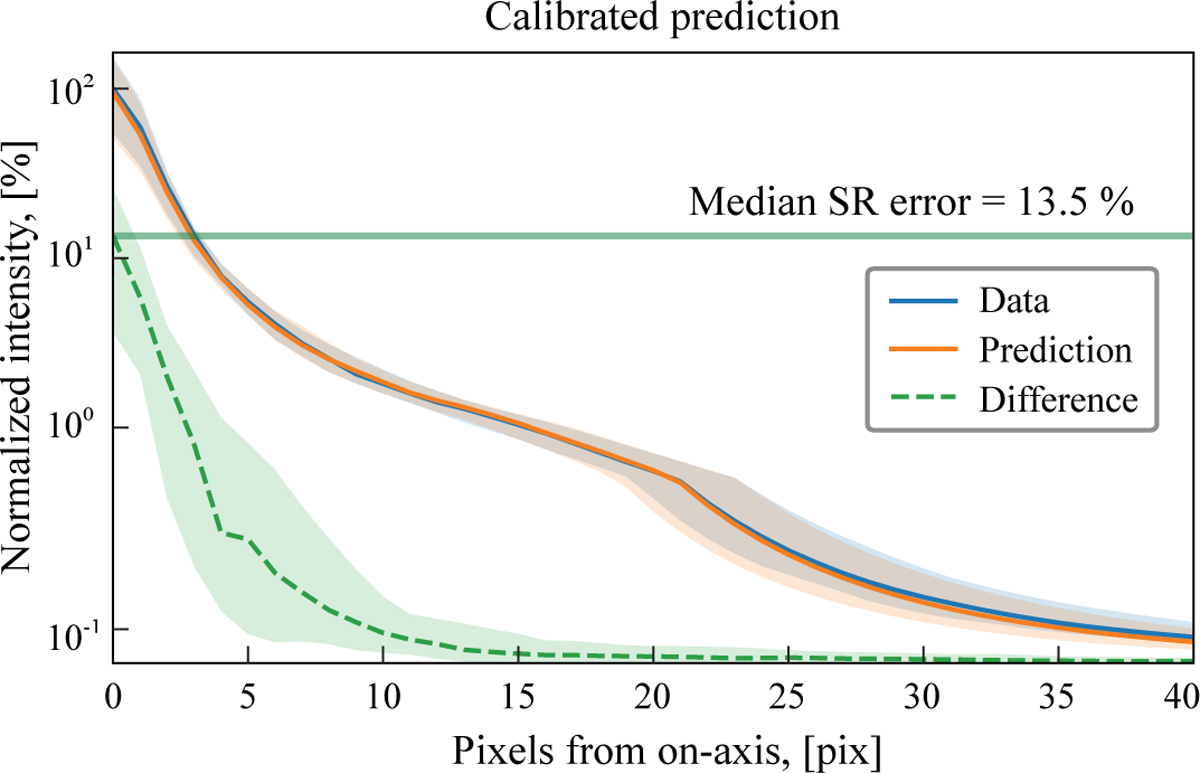
Median radial PSF profiles of the validation dataset. Error bars indicate the 1σ dispersion across the dataset. The profiles are averaged across all wavelengths. The apparent “kink” in the curves arises from the logarithmic scaling of the plot, which transitions to a linear scale just below the 1% level.
Current usage metrics show cumulative count of Article Views (full-text article views including HTML views, PDF and ePub downloads, according to the available data) and Abstracts Views on Vision4Press platform.
Data correspond to usage on the plateform after 2015. The current usage metrics is available 48-96 hours after online publication and is updated daily on week days.
Initial download of the metrics may take a while.