Fig. E.1.
Download original image
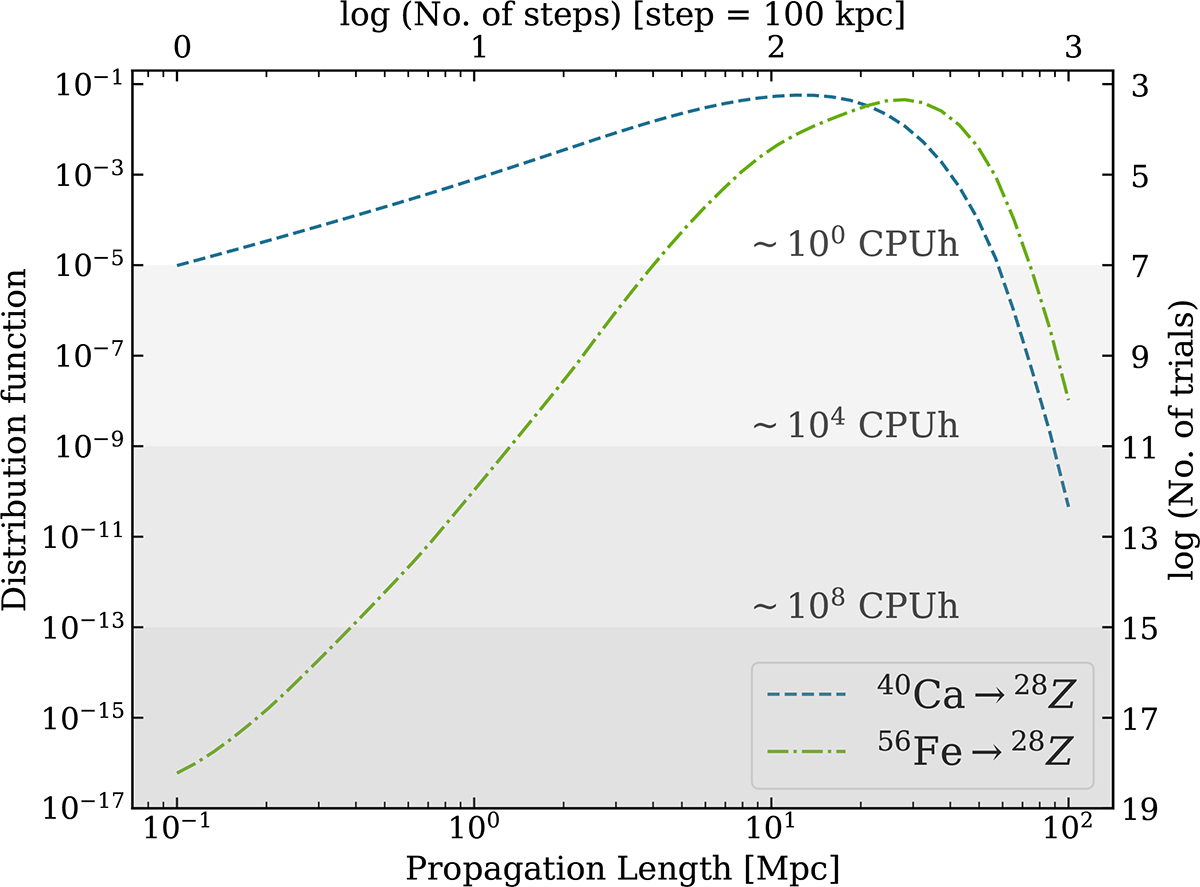
Estimate of the computational effort with a Monte Carlo approach needed to access the probability distributions shown by the lines by evaluating the analytic expressions in this paper (a few seconds for one CPU). The shaded bands correspond to portions of the distributions that can be accessed at the stated computational cost in CPU hours.
Current usage metrics show cumulative count of Article Views (full-text article views including HTML views, PDF and ePub downloads, according to the available data) and Abstracts Views on Vision4Press platform.
Data correspond to usage on the plateform after 2015. The current usage metrics is available 48-96 hours after online publication and is updated daily on week days.
Initial download of the metrics may take a while.