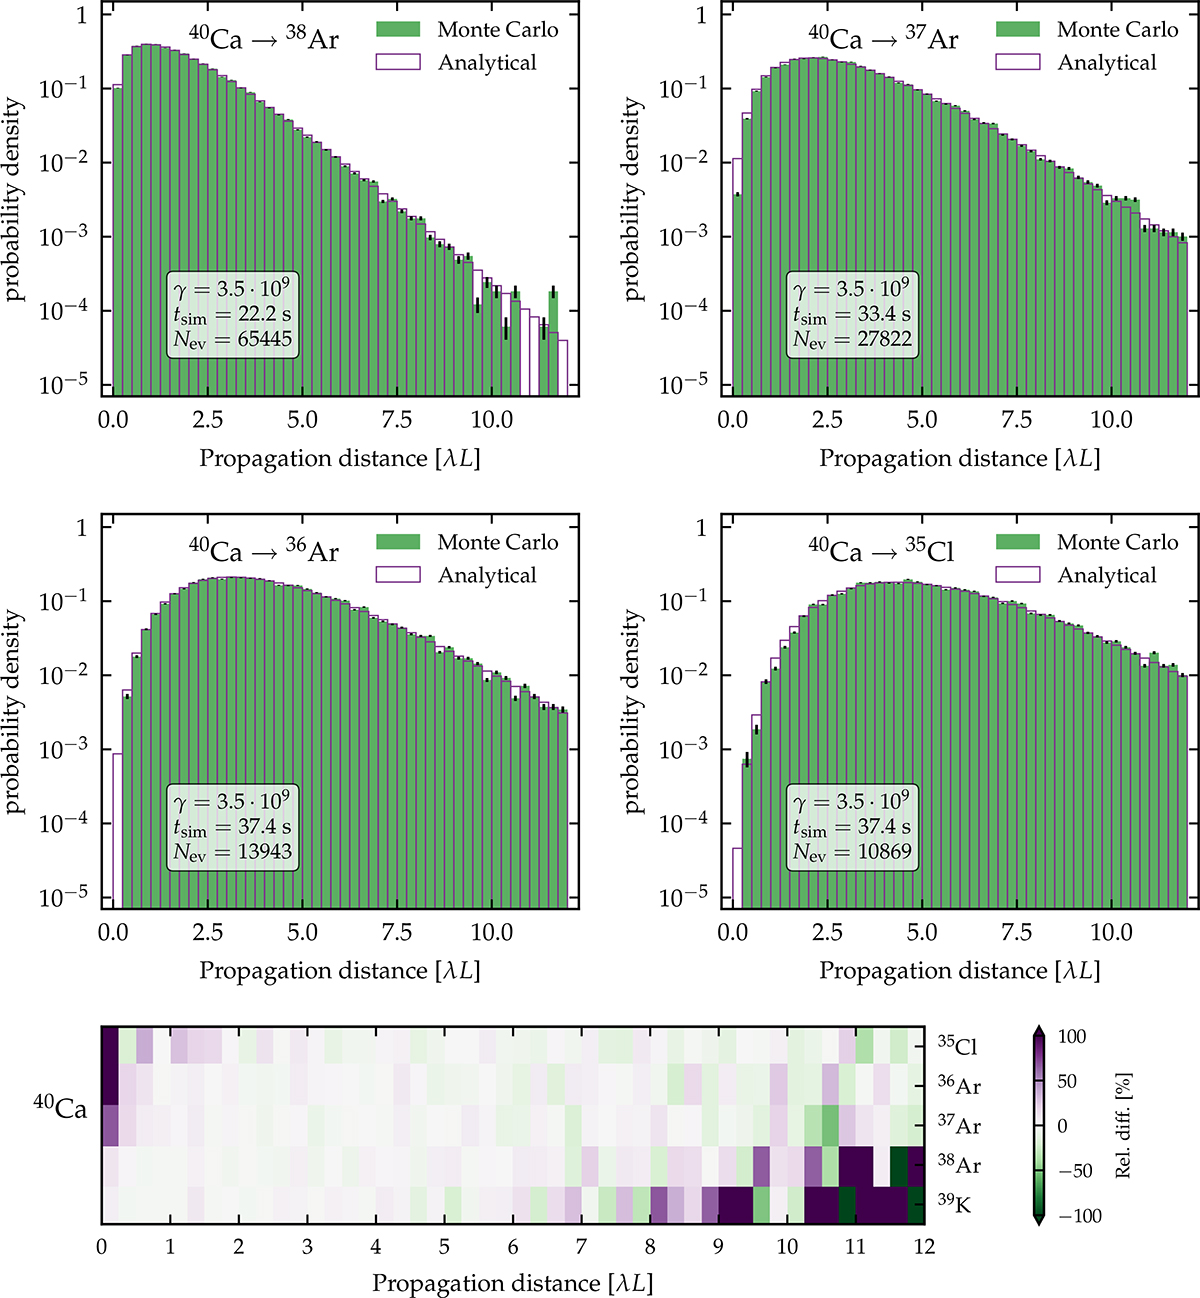
Fig. E.2.
Download original image
Comparison of CRPropa simulations and analytic distributions for a serial cascade involving nuclear species {40Ca→39K→38Ar→37Ar→36Ar→35Cl}. The four top panels show the probability distributions as a function of distance for cases with 2-5 nucleon losses. The bottom panel shows the relative differences between CRPropa and the analytic distributions. There is a row for each case, including the one-nucleon-loss distributions. Each case simulated 105 nuclei with γ = 3.5 ⋅ 109. The interaction length for 40Ca is the reference scale 1/λ.
Current usage metrics show cumulative count of Article Views (full-text article views including HTML views, PDF and ePub downloads, according to the available data) and Abstracts Views on Vision4Press platform.
Data correspond to usage on the plateform after 2015. The current usage metrics is available 48-96 hours after online publication and is updated daily on week days.
Initial download of the metrics may take a while.