Fig. 5.
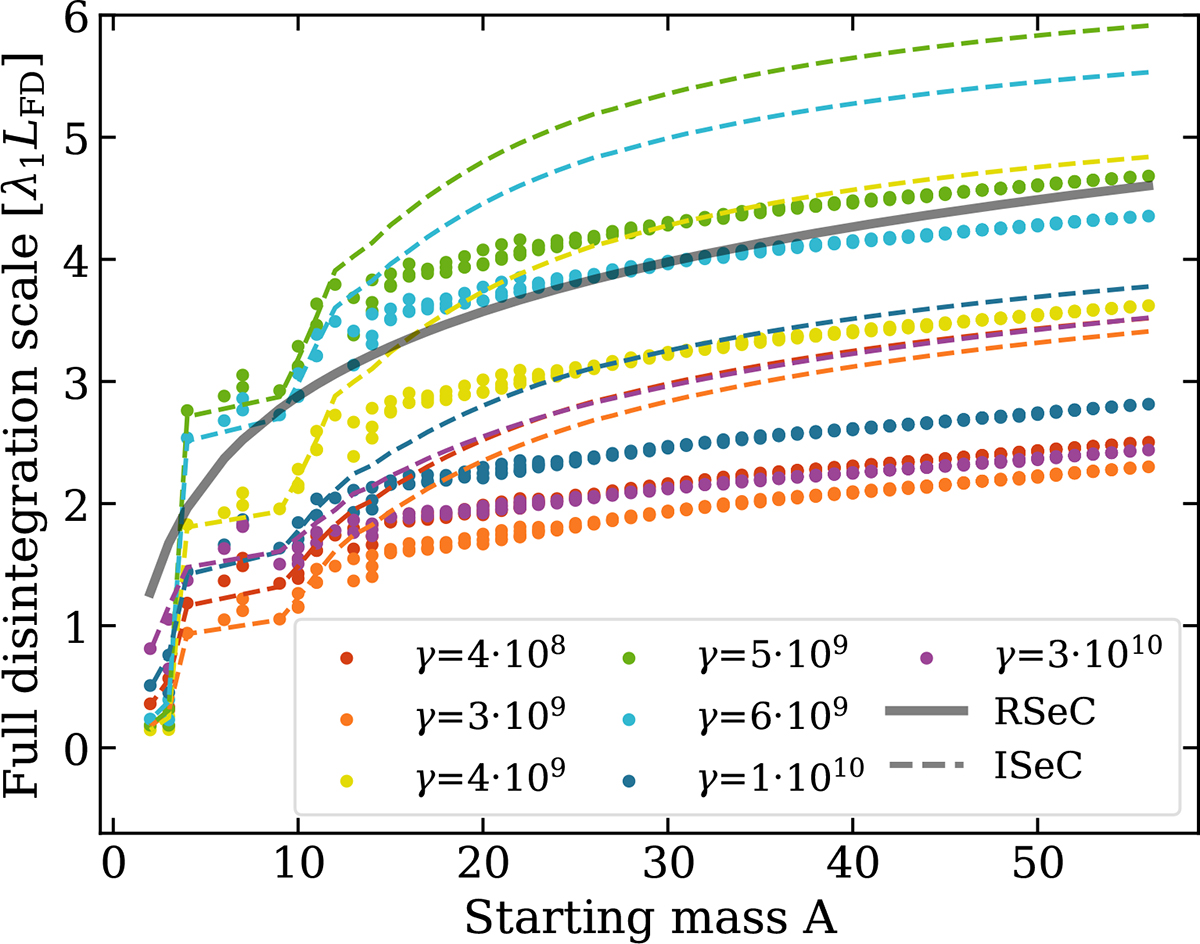
Download original image
Expected distance until full disintegration in units of the inverse of the mean interaction rate per nucleon 1/λ1. The black line corresponds to the canonical cascade (RSeC), the dashed lines represent ISeCs, and the scattered points show values for CoCs, where multiple points appear for each mass corresponding the multiple isobars. The boost is indicated by the color, as listed in the legend.
Current usage metrics show cumulative count of Article Views (full-text article views including HTML views, PDF and ePub downloads, according to the available data) and Abstracts Views on Vision4Press platform.
Data correspond to usage on the plateform after 2015. The current usage metrics is available 48-96 hours after online publication and is updated daily on week days.
Initial download of the metrics may take a while.