Fig. 7.
Download original image
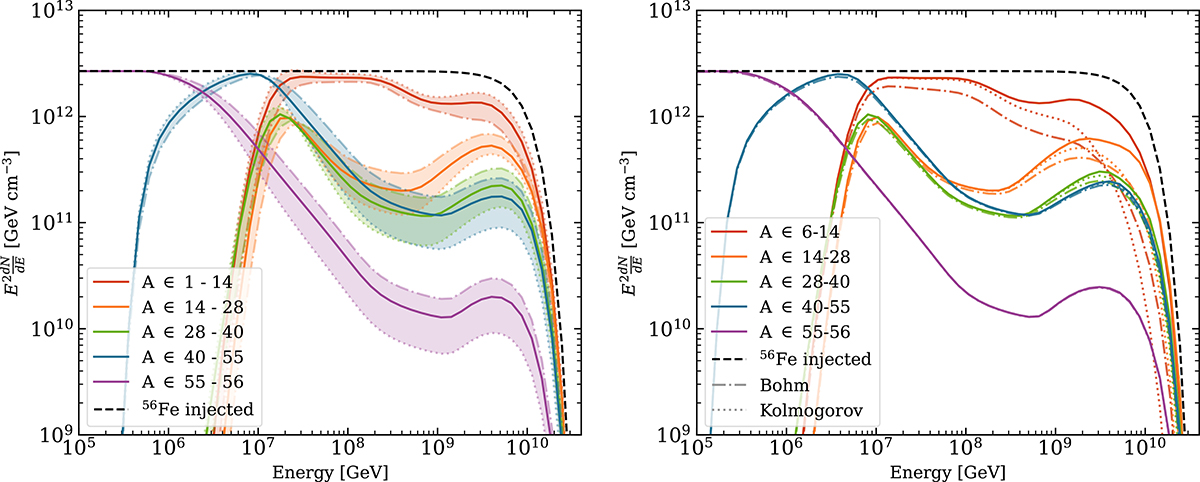
UHECR spectral densities of a GRB source in the optically thick scenario. Shaded regions and line styles indicate the effect of different model assumptions. Left: Influence of a time-varying injection with a fixed total injection. The case of a constant injection (solid lines) is contrasted with a quadratically increasing injection (dotted bound) and a linearly decreasing injection (dash-dotted bound). Right: Influence of rigidity-dependent escape assumptions. The solid lines represent advective escape, as in the left figure. The dash-dotted lines show the Bohmian diffusion, and the dotted lines show the effect of diffusion under a Kolmogorov-distributed turbulent magnetic field. Additional details are given in the text and in Appendix D.
Current usage metrics show cumulative count of Article Views (full-text article views including HTML views, PDF and ePub downloads, according to the available data) and Abstracts Views on Vision4Press platform.
Data correspond to usage on the plateform after 2015. The current usage metrics is available 48-96 hours after online publication and is updated daily on week days.
Initial download of the metrics may take a while.