Fig. 2
Download original image
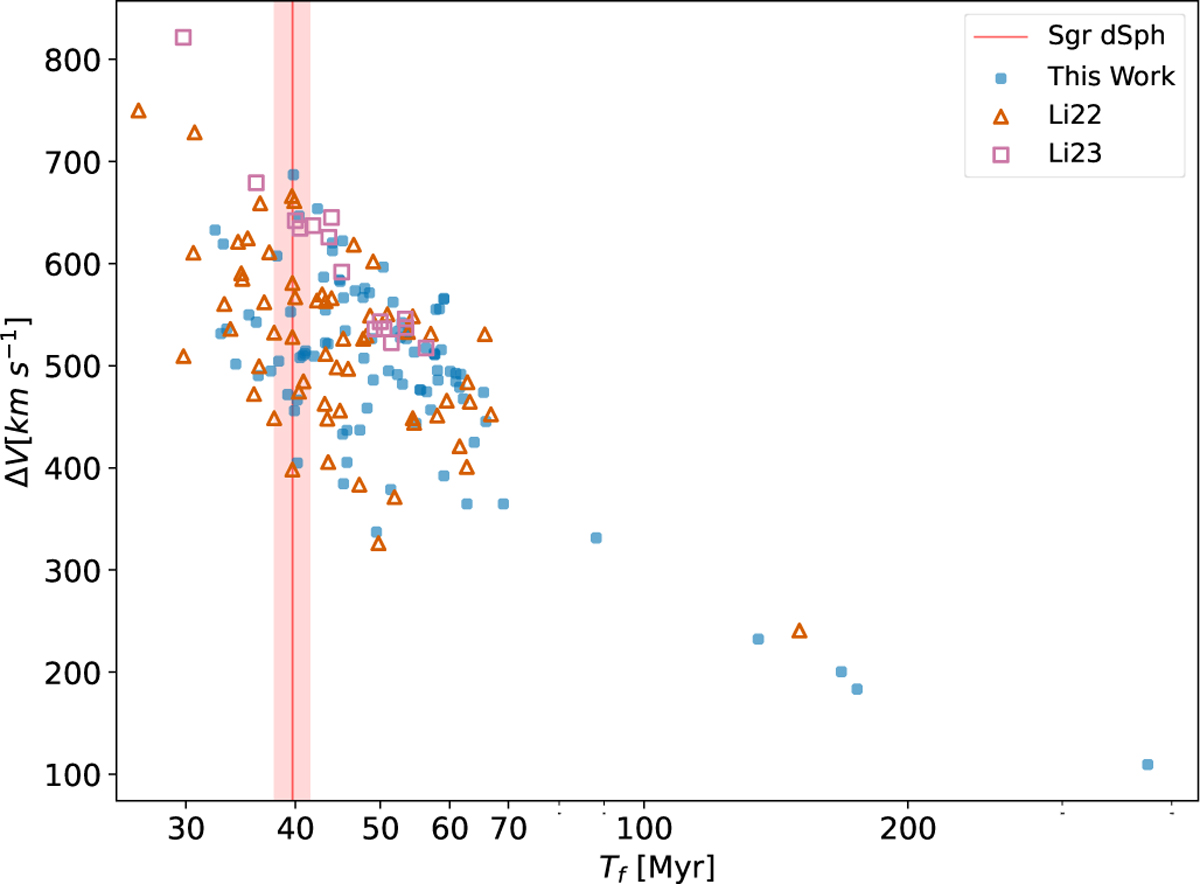
Relative velocity ∆V with respect to the Sgr dSph at pericentric passage versus flight time Tf on a logarithmic scale. Blue circles, orange triangles, and magenta squares represent results from this work, Li22, and Li23, respectively. Vertical red line indicates the 39.7 Myr flight time of the Sgr dSph since its most recent pericentric passage, with the shaded region representing the 1σ confidence interval.
Current usage metrics show cumulative count of Article Views (full-text article views including HTML views, PDF and ePub downloads, according to the available data) and Abstracts Views on Vision4Press platform.
Data correspond to usage on the plateform after 2015. The current usage metrics is available 48-96 hours after online publication and is updated daily on week days.
Initial download of the metrics may take a while.