Open Access
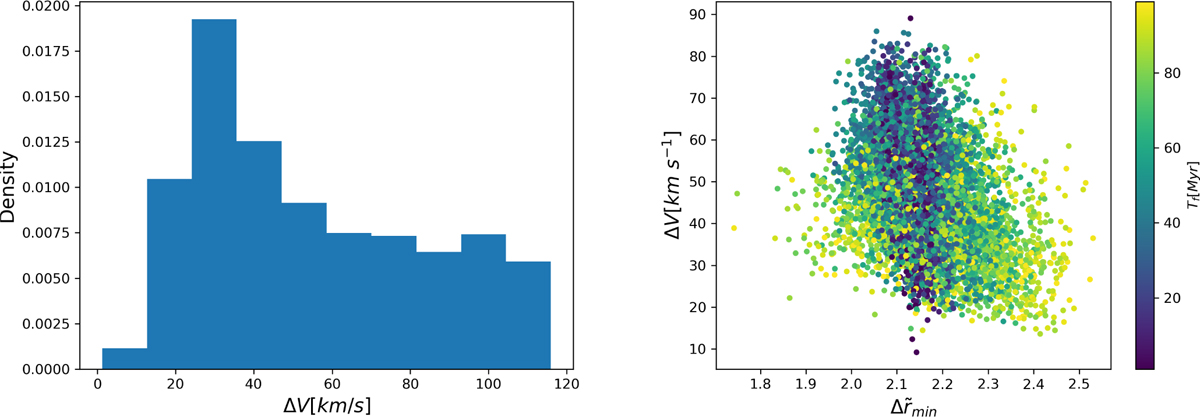
Fig. 6
Download original image
Left panel: distribution of the impulse imparted to stars uniformly distributed on the tidal radius of the Sgr dSph. Right panel: velocity difference between each star and the Sgr dSph’s center of mass at the stripping time, plotted against the normalized radial separation (∆r̄ = rmin/Rh), color coded by flight time.
Current usage metrics show cumulative count of Article Views (full-text article views including HTML views, PDF and ePub downloads, according to the available data) and Abstracts Views on Vision4Press platform.
Data correspond to usage on the plateform after 2015. The current usage metrics is available 48-96 hours after online publication and is updated daily on week days.
Initial download of the metrics may take a while.