Fig. 1
Download original image
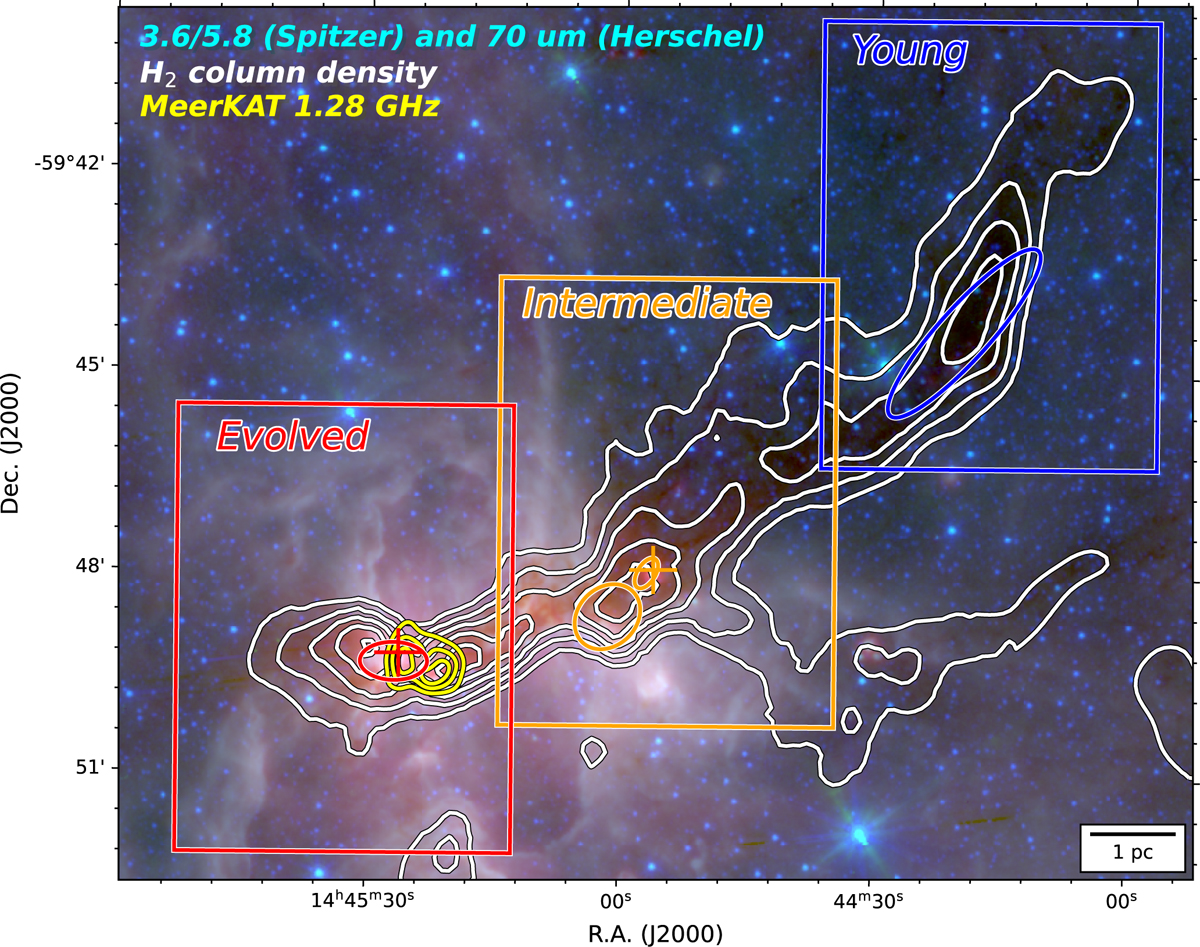
Background color map composites of Spitzer 3.6 and 5.8 μm and Herschel 70 μm images. The overlaid white contours show the high-resolution H2 column density map obtained from Sect. 4.1 with levels of 3.0, 5.0, 8.0, 12.6, and 20.0 × 1022 cm−2. The blue, orange, and red boxes outline the young, intermediate, and evolved parts, respectively. Massive clumps embedded in each part are shown with color ellipses. The yellow contours show MeerKAT 1.28 GHz continuum emission at levels of 100, 180, and 260 mJy beam−1 (8″). The orange cross shows the G316.763–0.011 maser spot for OH and H2O, while the red cross shows the G316.812–0.057 maser spot for OH, CH3OH, and H2O.
Current usage metrics show cumulative count of Article Views (full-text article views including HTML views, PDF and ePub downloads, according to the available data) and Abstracts Views on Vision4Press platform.
Data correspond to usage on the plateform after 2015. The current usage metrics is available 48-96 hours after online publication and is updated daily on week days.
Initial download of the metrics may take a while.