Fig. 2
Download original image
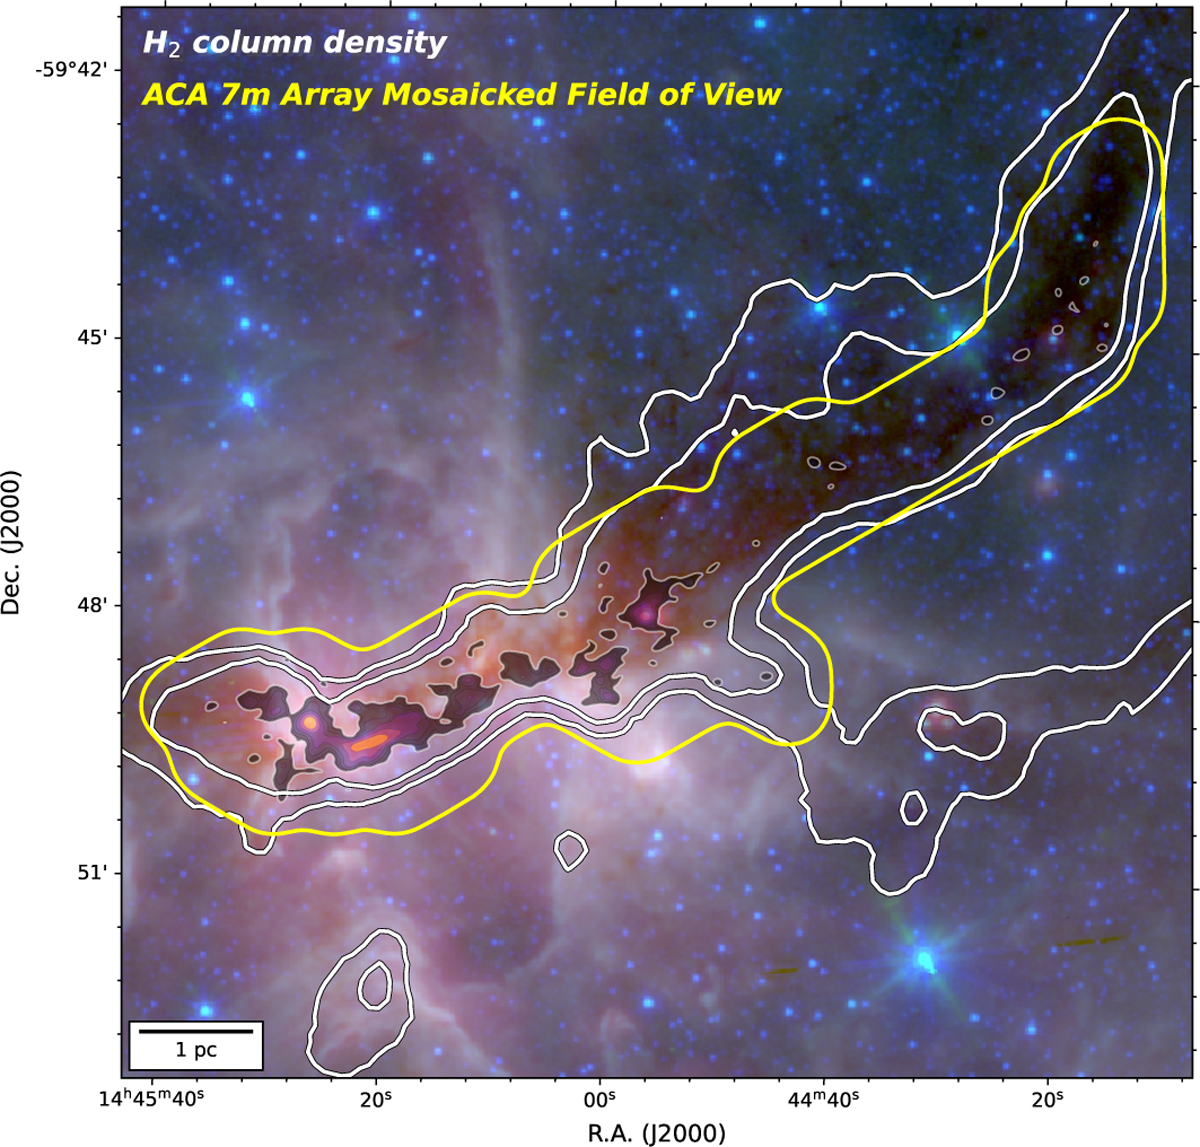
ACA 7 m continuum emission at 1.3 mm overlaid on the composite Spitzer 3.6 and 5.8 μm emission and Herschel 70 μm emission. The 1.3 mm map is shown with filled contours at levels of 10, 20, 40, 80,160, and 320 mJy beam−1. The mosaicked field of view is outlined by primary beam response (yellow contour at 0.2). The white contours define the dense region at levels of 3.0 and 5.0 × 1022 cm−2.
Current usage metrics show cumulative count of Article Views (full-text article views including HTML views, PDF and ePub downloads, according to the available data) and Abstracts Views on Vision4Press platform.
Data correspond to usage on the plateform after 2015. The current usage metrics is available 48-96 hours after online publication and is updated daily on week days.
Initial download of the metrics may take a while.