Fig. 3
Download original image
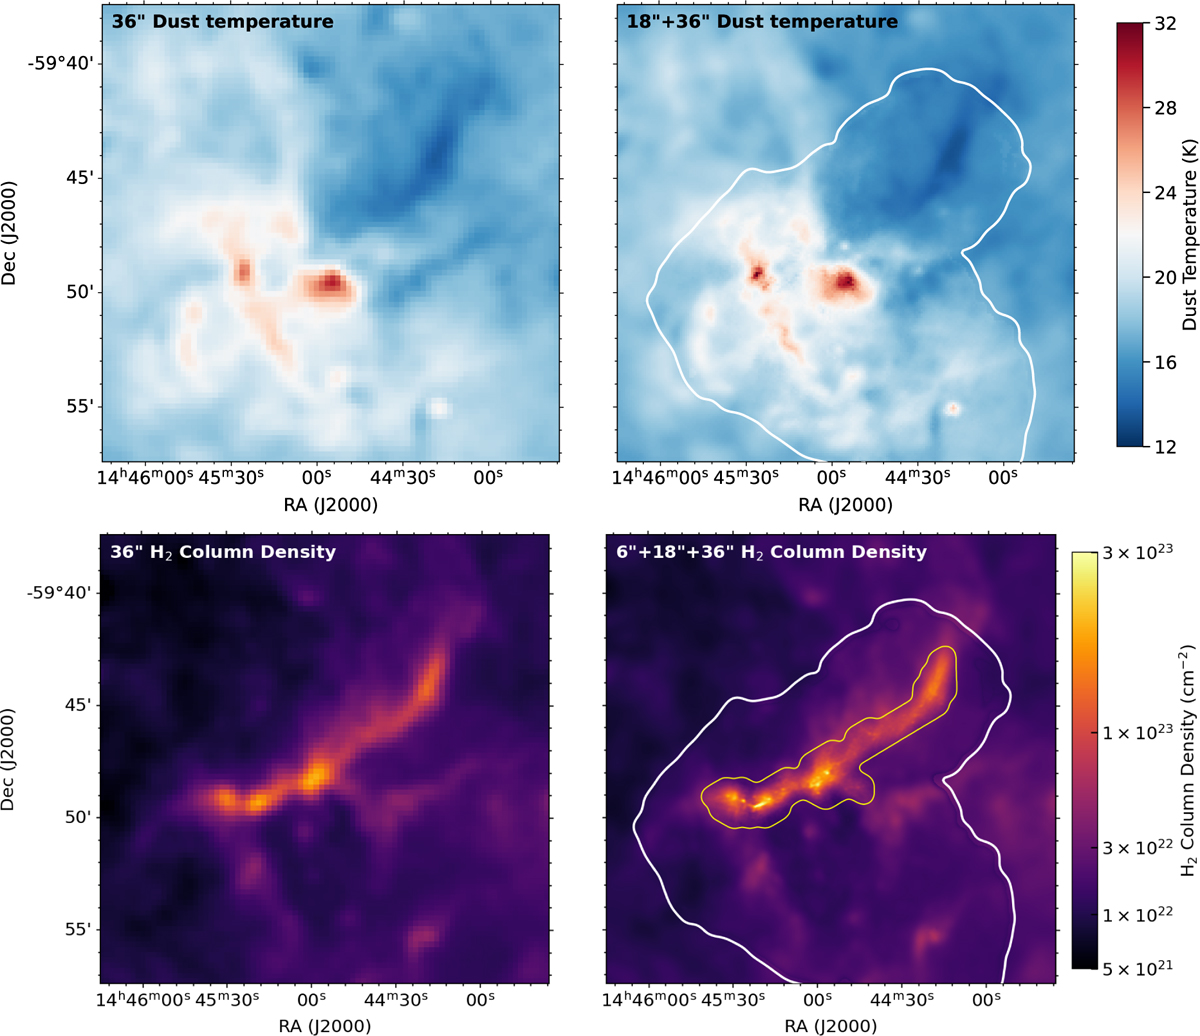
Comparison between low-resolution and multi-resolution maps of dust temperature (upper) and H2 column density (lower). The white and yellow polygons indicate the fields of view of the APEX and our ACA 7 m observations, respectively. For the temperature image, the resolution is ![]() inside and
inside and ![]() outside the white closed polygon. For the column density image, the resolution outside the yellow closed polygon is the same as the temperature map but as high as 6″ within the yellow closed polygon.
outside the white closed polygon. For the column density image, the resolution outside the yellow closed polygon is the same as the temperature map but as high as 6″ within the yellow closed polygon.
Current usage metrics show cumulative count of Article Views (full-text article views including HTML views, PDF and ePub downloads, according to the available data) and Abstracts Views on Vision4Press platform.
Data correspond to usage on the plateform after 2015. The current usage metrics is available 48-96 hours after online publication and is updated daily on week days.
Initial download of the metrics may take a while.