Fig. 6
Download original image
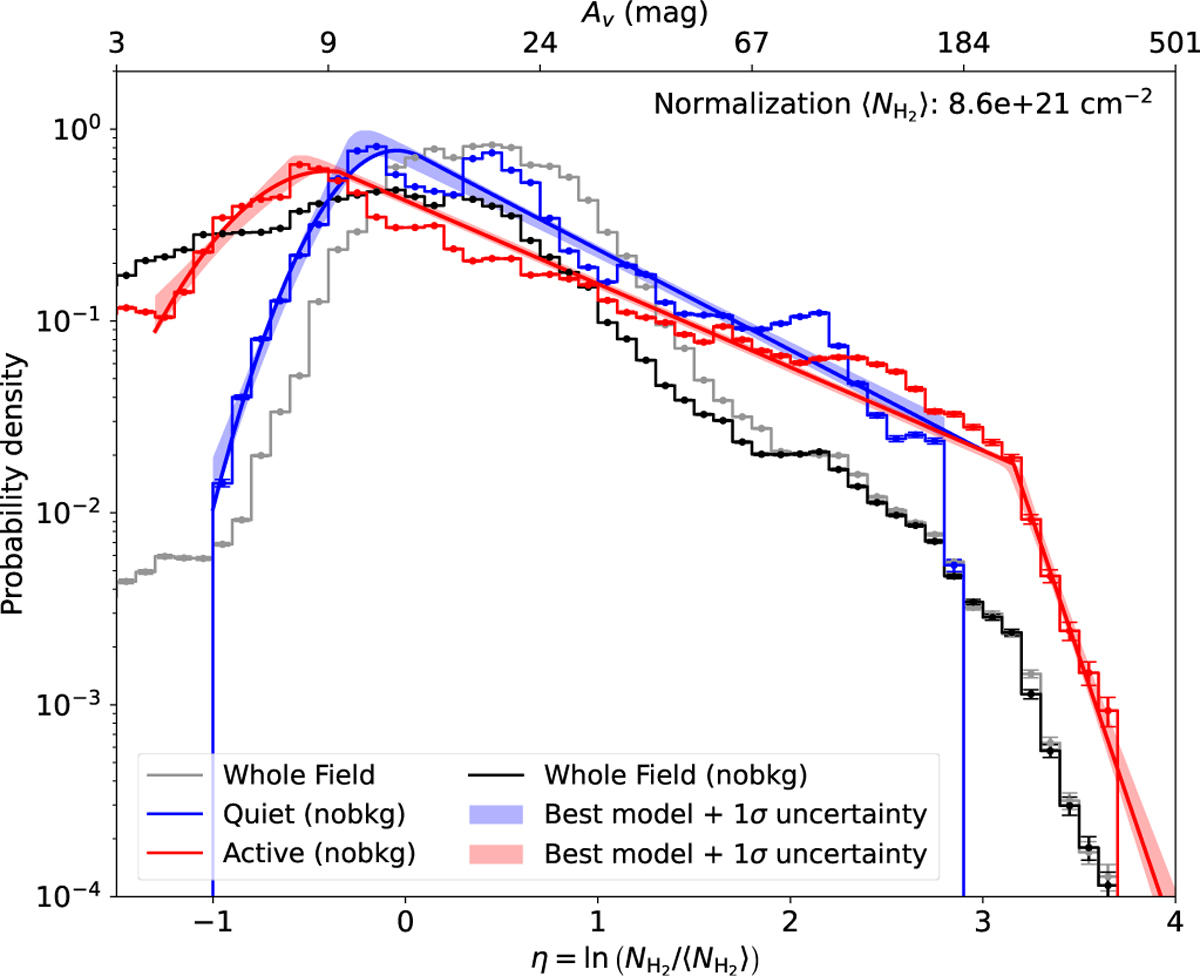
N-PDFs for the entire region before and after background subtraction shown in gray and black. N-PDFs for the northern quiet and southern active parts are shown in blue and red. The best-fitting models and their posterior 1σ confidence intervals are shown with lines and shading. Visual extinction is also shown on the top axis.
Current usage metrics show cumulative count of Article Views (full-text article views including HTML views, PDF and ePub downloads, according to the available data) and Abstracts Views on Vision4Press platform.
Data correspond to usage on the plateform after 2015. The current usage metrics is available 48-96 hours after online publication and is updated daily on week days.
Initial download of the metrics may take a while.