Fig. 12.
Download original image
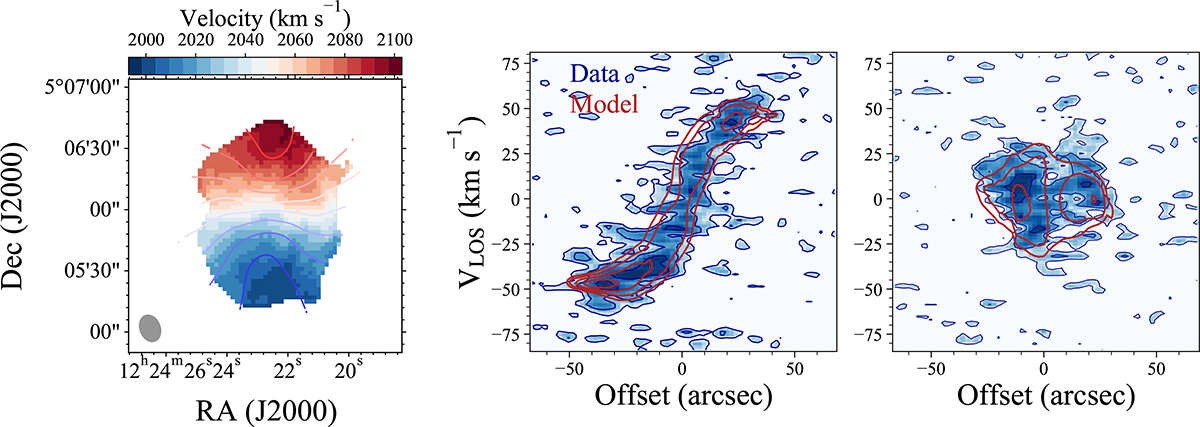
Comparison between the fitted 3DBarolo model and the observational data. Left: Observed H I velocity field overlaid with model velocity contours from the 3DBarolo algorithm. Middle and Right: Kinematical major- and minor-axis PV diagram. The offsets are measured from the H I center along the major or minor axes, respectively. The observed data are shown in blue, and the red contours show the best-fitting model.
Current usage metrics show cumulative count of Article Views (full-text article views including HTML views, PDF and ePub downloads, according to the available data) and Abstracts Views on Vision4Press platform.
Data correspond to usage on the plateform after 2015. The current usage metrics is available 48-96 hours after online publication and is updated daily on week days.
Initial download of the metrics may take a while.