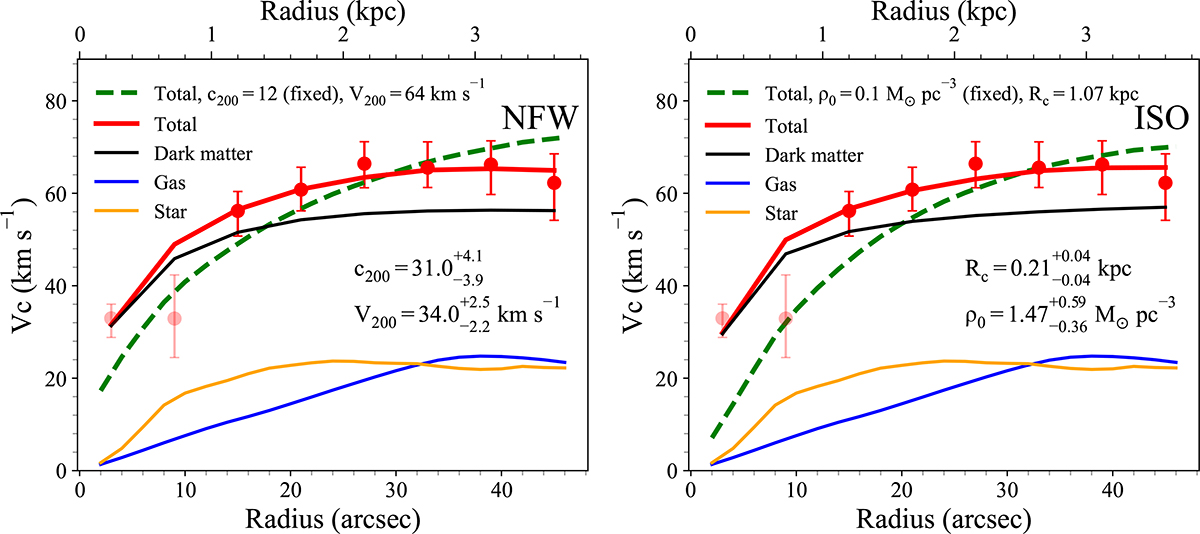
Fig. 14.
Download original image
Decomposition of the observed rotation curve of VCC 693 using the NFW (left panel) and spherical pseudo-isothermal (ISO, right panel) dark matter halo models. The red points and red lines represent the observed circular velocity and best-fitting rotation curve. The first two light red points indicate data affected by the bar, but including them in the fitting does not significantly affect the fitted parameters. The blue, orange, and black lines show the contribution of the stellar, gas, and dark matter components to the total circular velocity, respectively. The best-fitting rotation curves with c200 fixed at 12 in the left panel and ρ0 fixed at 0.1 M⊙ pc−3 in the right panel are overplotted with dashed green lines.
Current usage metrics show cumulative count of Article Views (full-text article views including HTML views, PDF and ePub downloads, according to the available data) and Abstracts Views on Vision4Press platform.
Data correspond to usage on the plateform after 2015. The current usage metrics is available 48-96 hours after online publication and is updated daily on week days.
Initial download of the metrics may take a while.