Fig. 15.
Download original image
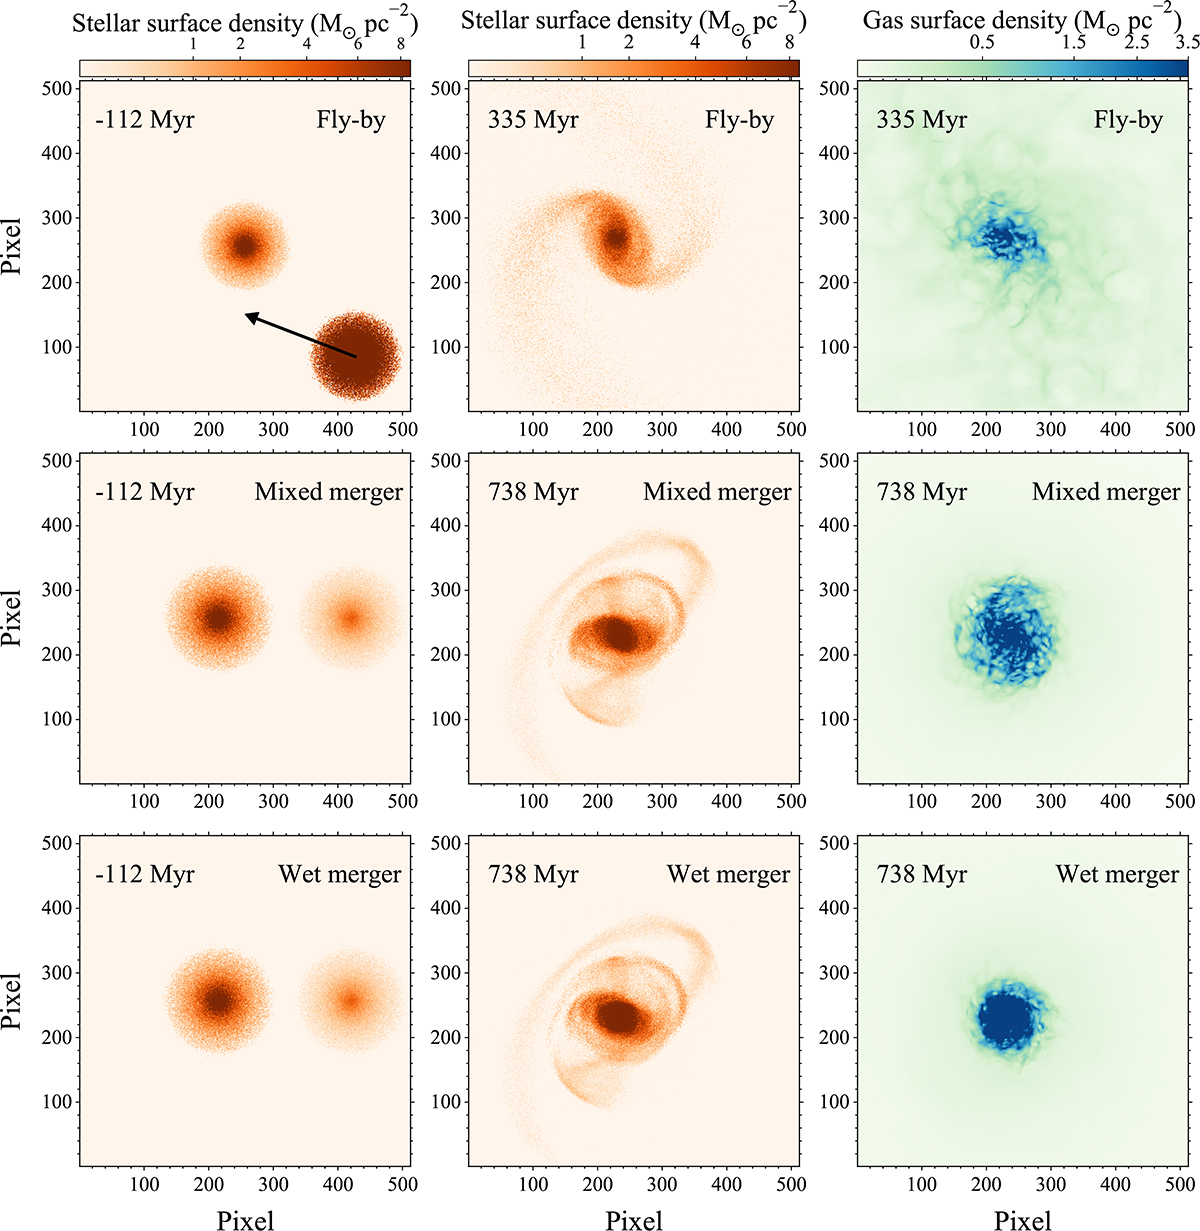
Projected surface density distribution of the stellar (orange) and gas (blue) particles. Top: fly-by scenario. Middle: mixed merger scenario. Bottom: wet merger scenario. The left panels show the stellar snapshots at the beginning of the simulation. The middle and right panels display selected snapshots highlighting the special structures. The simulations are performed with a spatial resolution of ∼50 pc. We define the first pericentric passage of the two galaxies in the merger scenario as the zeropoint in time. In the fly-by scenario, the black arrow marks the trajectory of the massive galaxy.
Current usage metrics show cumulative count of Article Views (full-text article views including HTML views, PDF and ePub downloads, according to the available data) and Abstracts Views on Vision4Press platform.
Data correspond to usage on the plateform after 2015. The current usage metrics is available 48-96 hours after online publication and is updated daily on week days.
Initial download of the metrics may take a while.