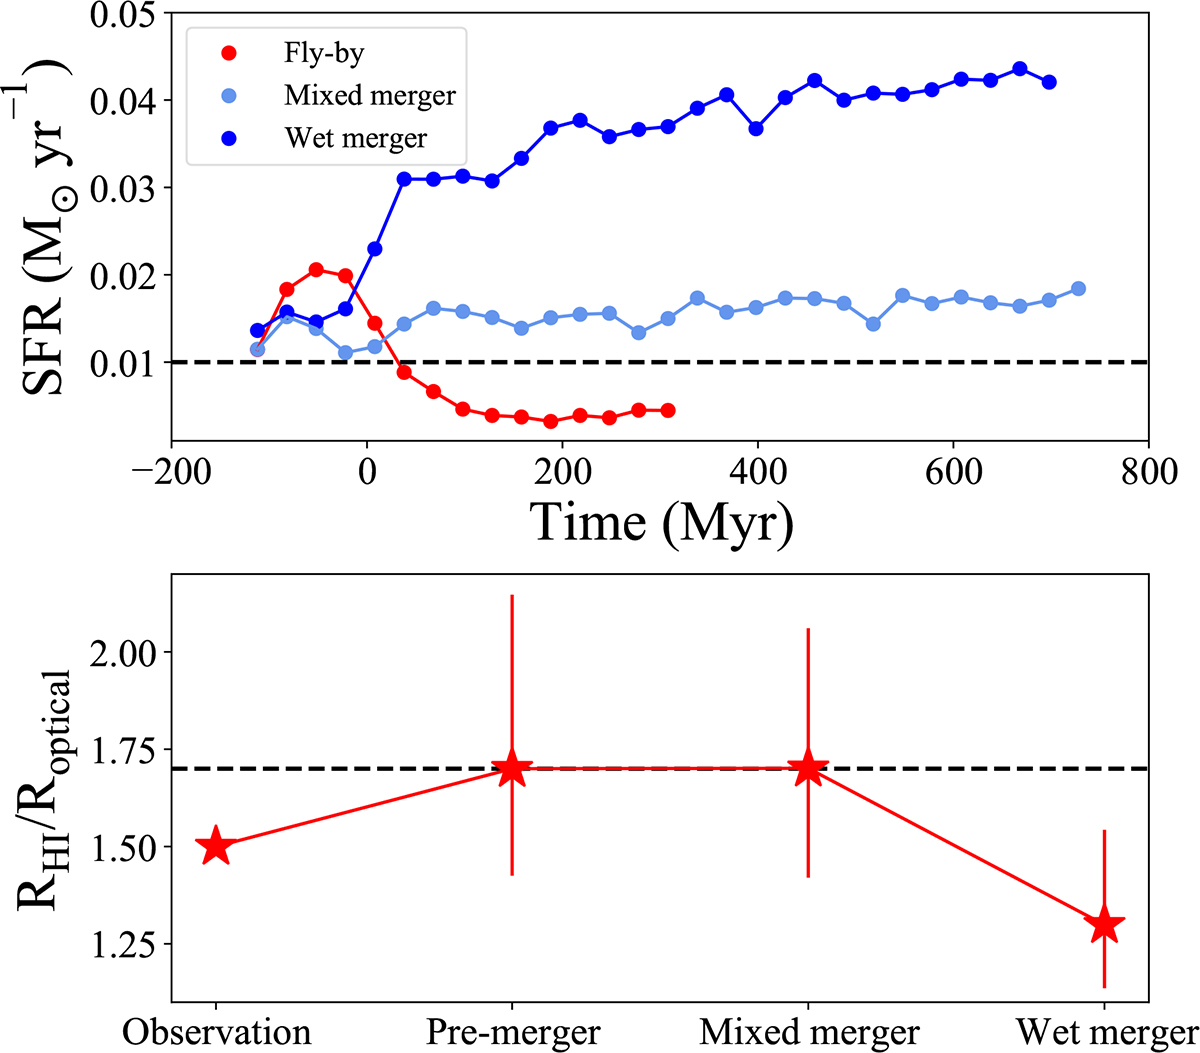
Fig. 16.
Download original image
Comparison of the SFR (top) and RH I/Roptical (bottom) in the three scenarios. The top panel shows the evolution of the SFR over time for the fly-by (red), mixed merger (light blue), and wet merger (blue) simulations. We define the first pericentric passage of the two galaxies in the merger scenario as the zeropoint in time. The dashed black lines represent the values from the isolated disk simulation. The bottom panel shows the measured RH I/Roptical values for observations of VCC 693 (left) and for the simulations (right three points: pre-merger, mixed merger, and wet merger). The optical radius of observations and typical value of late-type galaxies (dashed black line) are measured from the 25 mag arcsec−2 isophote of the optical B-band image, while in the simulations, we adopt the optical radius corresponding to a pre-merger RH I/Roptical of 1.7 as the reference (log Σstar = 0.48 M⊙ pc−2), with error bars indicating a ±0.2 dex range in log Σstar.
Current usage metrics show cumulative count of Article Views (full-text article views including HTML views, PDF and ePub downloads, according to the available data) and Abstracts Views on Vision4Press platform.
Data correspond to usage on the plateform after 2015. The current usage metrics is available 48-96 hours after online publication and is updated daily on week days.
Initial download of the metrics may take a while.