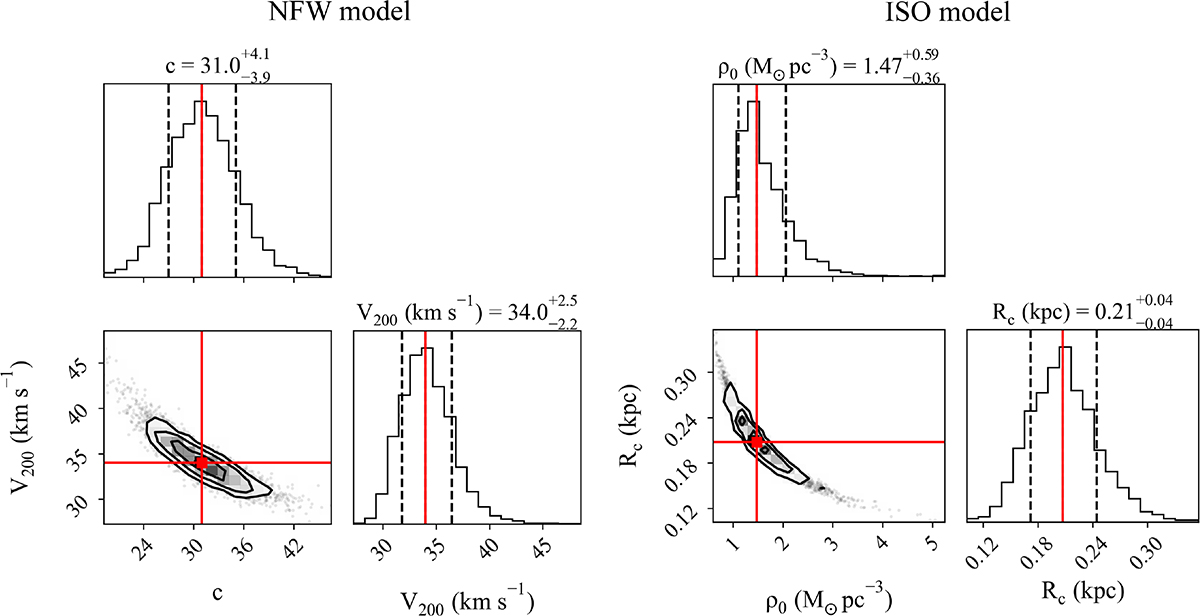
Fig. D.1.
Download original image
Posterior distributions of parameters of the NFW (left) and ISO (right) models fitted to VCC 693. The red squares indicate the maximum-likelihood values. The black contours represent the 16th, 50th, and 84th percentiles of the distribution. In each histogram, the vertical red line indicates the maximum-likelihood value, while the two dashed black lines mark the 16th and 84th percentile confidence intervals.
Current usage metrics show cumulative count of Article Views (full-text article views including HTML views, PDF and ePub downloads, according to the available data) and Abstracts Views on Vision4Press platform.
Data correspond to usage on the plateform after 2015. The current usage metrics is available 48-96 hours after online publication and is updated daily on week days.
Initial download of the metrics may take a while.