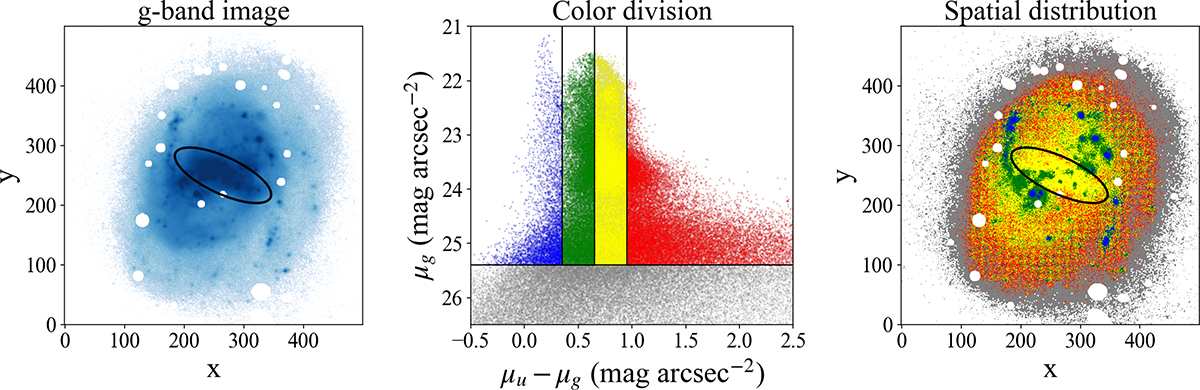
Fig. 3.
Download original image
Left panel: NGVS g-band image after masking background galaxies. Middle panel: Diagram showing the u-band surface brightness vs. u − g colors. The analysis is limited to pixels brighter than μg = 25.4 mag arcsec−2, and the pixels are divided into four tranches according to their u − g colors. The color boundaries between the blue, green, yellow, and red tranches are 0.35, 0.65, and 0.95. Right panel: spatial distribution of the u − g colors, where the colors correspond to those of the tranches in the middle panel. The ellipse in the left and right panels marks the location of the stellar bar.
Current usage metrics show cumulative count of Article Views (full-text article views including HTML views, PDF and ePub downloads, according to the available data) and Abstracts Views on Vision4Press platform.
Data correspond to usage on the plateform after 2015. The current usage metrics is available 48-96 hours after online publication and is updated daily on week days.
Initial download of the metrics may take a while.