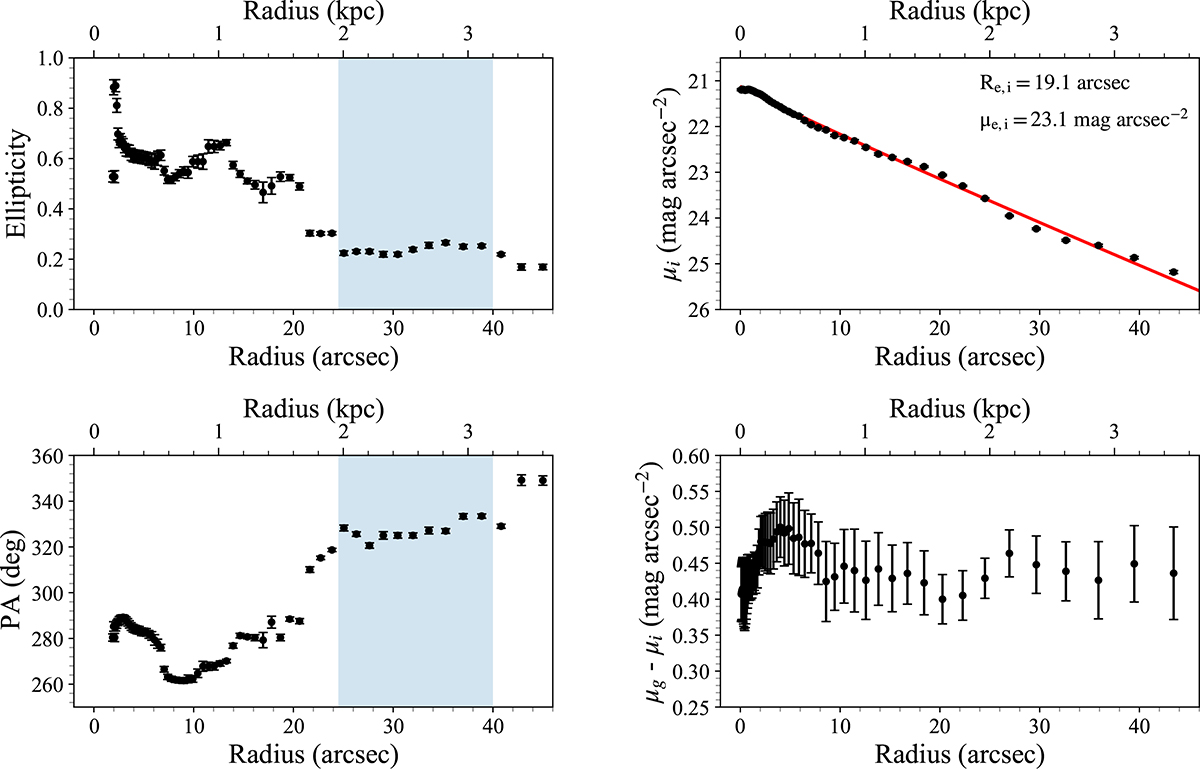
Fig. 4.
Download original image
Isophotal analysis of the NGVS images of VCC 693. Left: radial profiles of the ellipticity (top) and position angle (PA; bottom). Right: radial profiles of the i-band surface brightness (top) and g − i color (bottom). The red line shows the Sérsic profile best fit to the surface brightness profile, and the fitted values of the effective radius Re, i and the effective surface brightness μe, i are shown in the panel. The blue shadow regions in the two left panels mark the region used to derive the disk ε and PA.
Current usage metrics show cumulative count of Article Views (full-text article views including HTML views, PDF and ePub downloads, according to the available data) and Abstracts Views on Vision4Press platform.
Data correspond to usage on the plateform after 2015. The current usage metrics is available 48-96 hours after online publication and is updated daily on week days.
Initial download of the metrics may take a while.