Fig. 5.
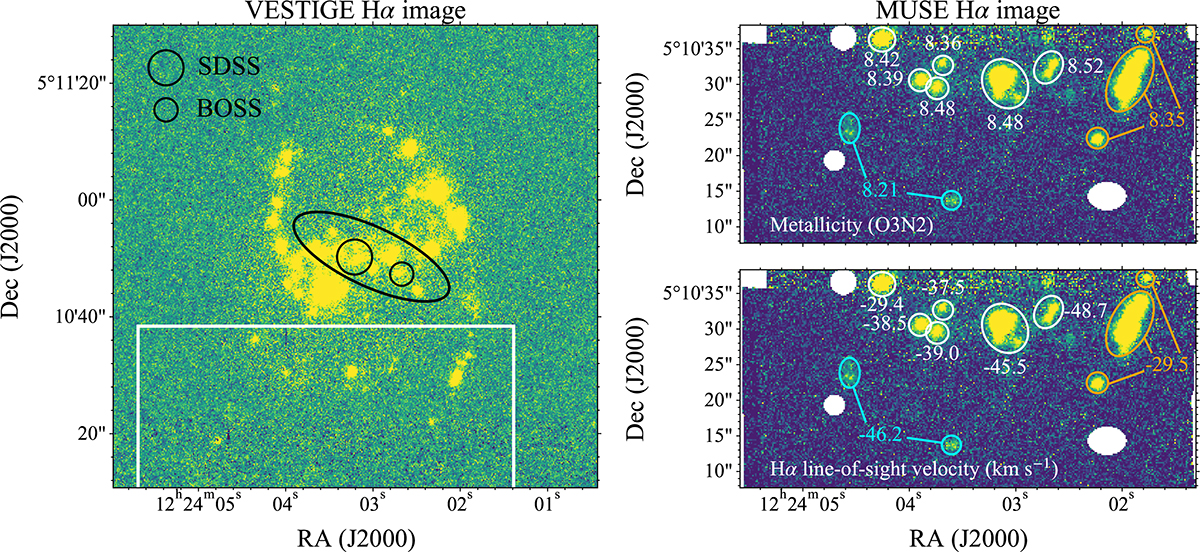
Download original image
Hα flux density maps from the VESTIGE (left) and MUSE (right) observations. The MUSE observations from the archives cover only about one-third of the southern region of VCC 693, as shown in the white rectangle. The black circles mark the locations and sizes of SDSS and BOSS spectra fibers. The ellipse in the left panel approximately marks the location of the stellar bar. We identified the star-forming regions with Hα emission and measured their metallicity and Hα velocity, as indicated in the top right and bottom right panels, respectively. The MUSE star-forming regions are indicated with ellipses of different colors. The spectra of the bottom left two star-forming regions (in green or blue) and of the rightmost three regions (in yellow) were summed individually to increase the S/N.
Current usage metrics show cumulative count of Article Views (full-text article views including HTML views, PDF and ePub downloads, according to the available data) and Abstracts Views on Vision4Press platform.
Data correspond to usage on the plateform after 2015. The current usage metrics is available 48-96 hours after online publication and is updated daily on week days.
Initial download of the metrics may take a while.