Fig. 6.
Download original image
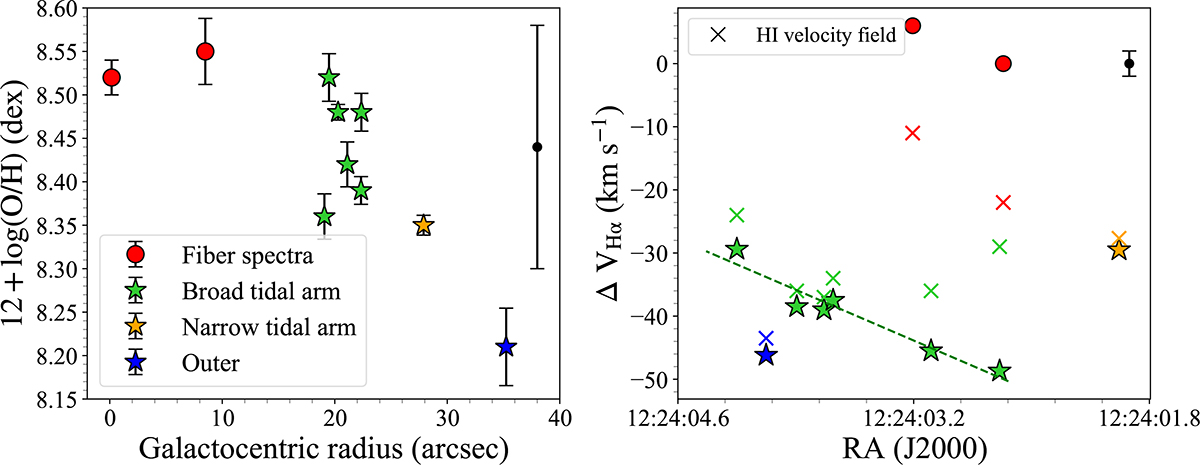
Left panel: relation between the gas-phase metallicity 12 + log(O/H) and galactocentric radius for each star-forming regions. Right panel: relation between the Hα velocity deviations from the systemic velocity and RA. The red, green, yellow, and blue points represent the results from fiber spectra, broad tidal arm, narrow tidal arm, and outer regions, respectively. The H I velocity deviations from the systemic velocity are indicated by a cross in corresponding colors. The error bars of the points in the left panel reflect the measurement uncertainties, whereas the systematic error of the gas-phase metallicity measured by the O3N2 calibration method (∼0.14 dex, Pettini & Pagel 2004) and the uncertainty caused by the width of the MUSE instrumental profile (∼1 km s−1, Weilbacher et al. 2020) are shown in the upper right corner of each panel.
Current usage metrics show cumulative count of Article Views (full-text article views including HTML views, PDF and ePub downloads, according to the available data) and Abstracts Views on Vision4Press platform.
Data correspond to usage on the plateform after 2015. The current usage metrics is available 48-96 hours after online publication and is updated daily on week days.
Initial download of the metrics may take a while.