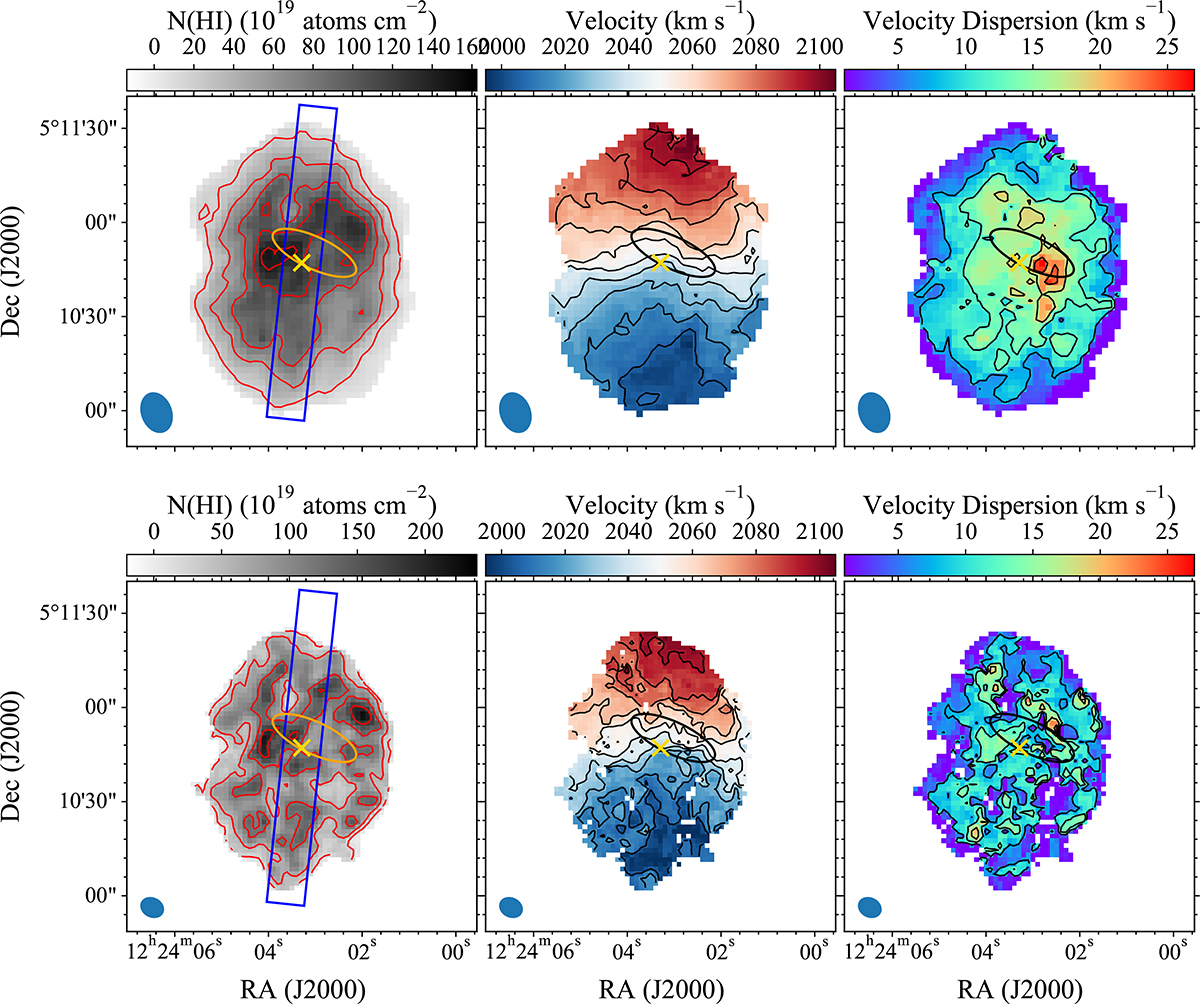
Fig. 9.
Download original image
H I moment maps of VCC 693. The top three panels show the maps calculated from the natural-weighted cube, whereas the bottom three show those from the robust-weighted cube. The left panels show the H I column density maps (MOMENT0). The column density contours are at levels of (2, 5, 8, 11, 14)×1020 cm−2 for the natural-weighted map and at (2, 6, 12, 18)×1020 cm−2 for the robust-weighted map. The blue rectangle corresponds to the cut through the galaxy with a width of 12″, which was used to measure the H I column density profiles in Figure 10. The middle panels show the intensity-weighted H I velocity field (MOMENT1). The velocity contours span the range 2005–2095 km s−1 with 10 km s−1 intervals. The right panels show the velocity dispersion maps (MOMENT2), and the contours are drawn at 4 km s−1 intervals. The ellipses and yellow crosses in each panel mark the bar and H I center, respectively. The beam sizes of natural- and robust-weighted cubes are shown in the bottom left corner.
Current usage metrics show cumulative count of Article Views (full-text article views including HTML views, PDF and ePub downloads, according to the available data) and Abstracts Views on Vision4Press platform.
Data correspond to usage on the plateform after 2015. The current usage metrics is available 48-96 hours after online publication and is updated daily on week days.
Initial download of the metrics may take a while.