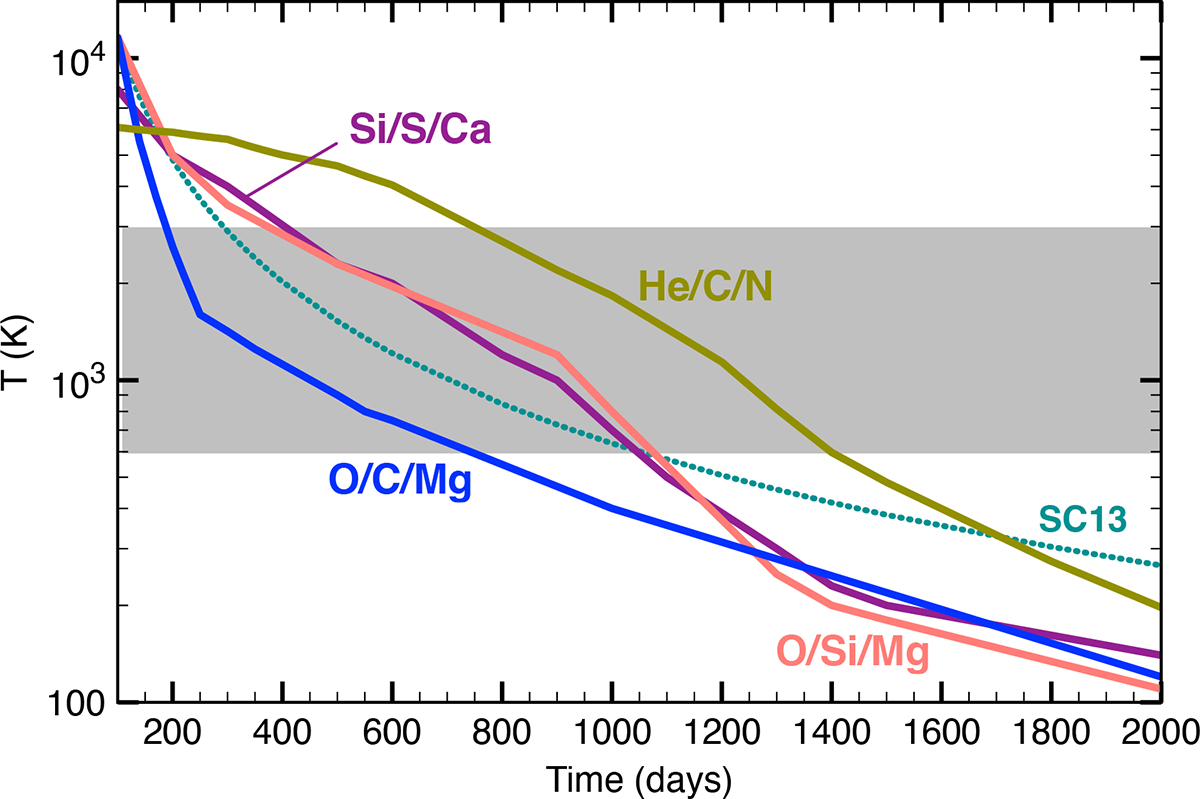
Fig. 3.
Download original image
Gas temperature for the ejecta regions defined in Table 2 as a function of the post-explosion time from Kozma & Fransson (1998), except the O/C/Mg zone where values are from Liljegren et al. (2020). The label SC13 refers to the temperature profile used in Sarangi & Cherchneff (2013). The shaded area represents the temperature regime at which dust forms in dust-producing experiments in the laboratory (e.g. high-temperature flame or vapour condensation experiments).
Current usage metrics show cumulative count of Article Views (full-text article views including HTML views, PDF and ePub downloads, according to the available data) and Abstracts Views on Vision4Press platform.
Data correspond to usage on the plateform after 2015. The current usage metrics is available 48-96 hours after online publication and is updated daily on week days.
Initial download of the metrics may take a while.