Fig. 13
Download original image
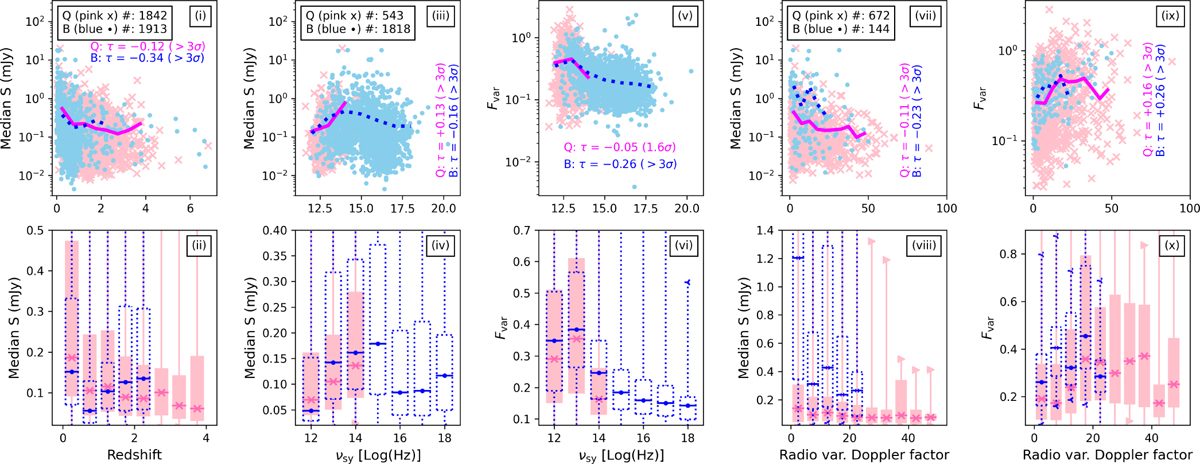
Distribution of median flux density against redshift (i and ii), median flux density and Fvar against synchrotron peak frequency (iii–vi), and median flux density and Fvar against radio variability Doppler factor (vii–x) in ZTF-only merged light curves of the sources in the CAZ catalog. Pink crosses and solid markings refer to FSRQs (Q); blue dots and dotted markings refer to BLLs (B). The top panels are scatter plots (with y-axis in logarithmic scales), where the binned running average is represented using lines (solid for FSRQs and dotted for BLLs). Kendall’s τ correlation coefficient and significance are reported for FSRQs and BLLs. In the bottom panels, we show the binned box plots of each scatter plot. The averages and box plots are both only shown for bins with at least ten data points. In the top panels we show all data points, while in the bottom panels we zoom in on the boxes.
Current usage metrics show cumulative count of Article Views (full-text article views including HTML views, PDF and ePub downloads, according to the available data) and Abstracts Views on Vision4Press platform.
Data correspond to usage on the plateform after 2015. The current usage metrics is available 48-96 hours after online publication and is updated daily on week days.
Initial download of the metrics may take a while.