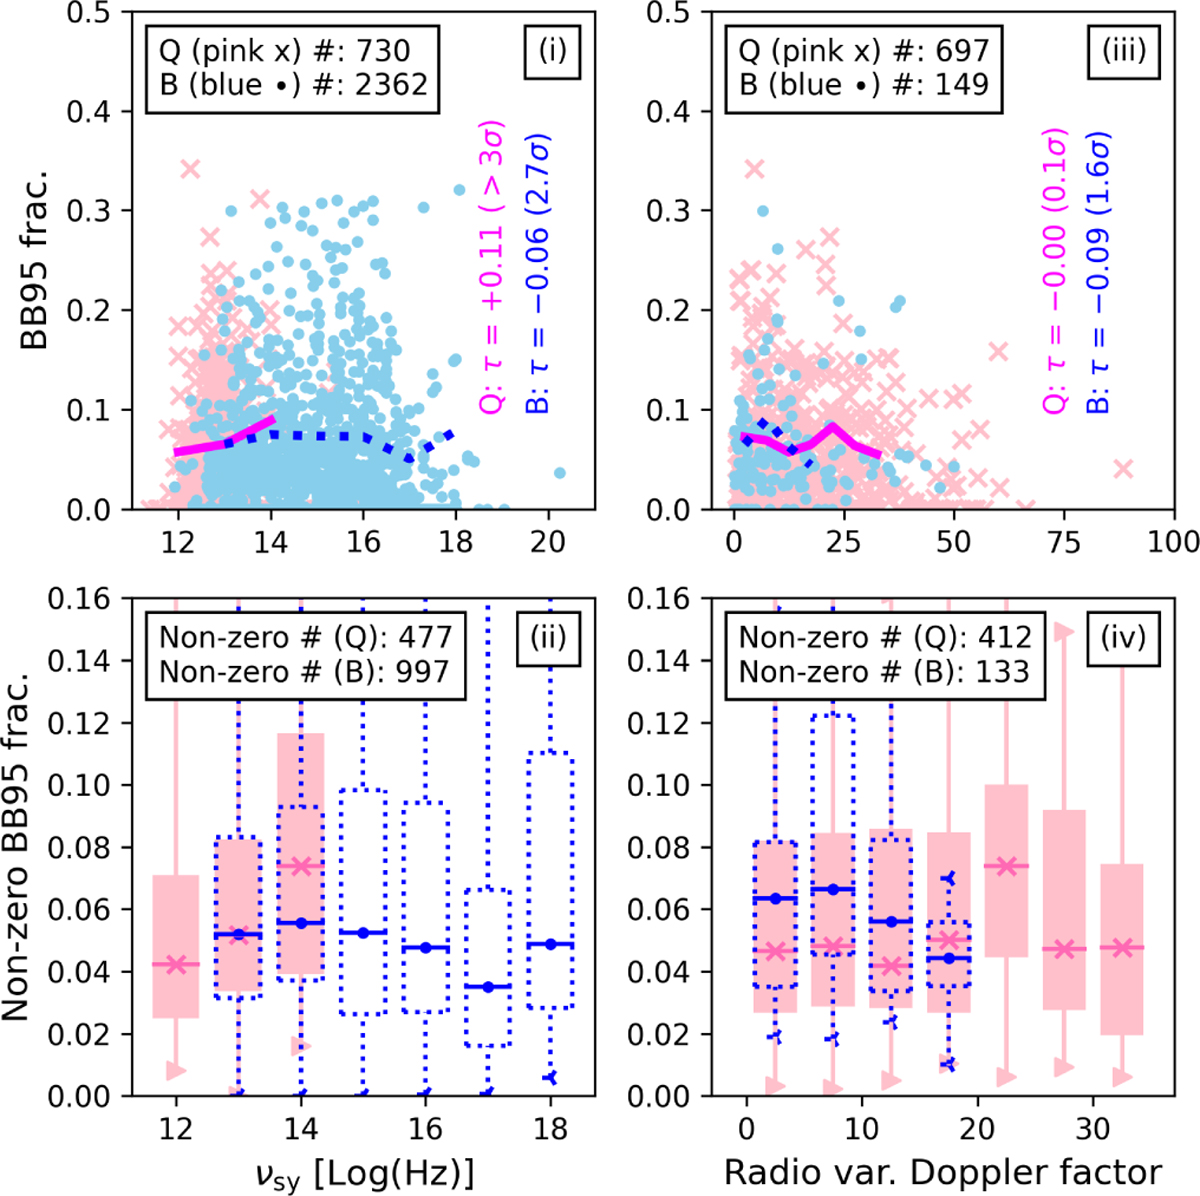
Fig. 14
Download original image
Distribution of BB 95 (with respect to all BB) fraction against synchrotron peak frequency (i and ii) and radio variability Doppler factor (iii and iv). Pink crosses and solid markings refer to FSRQs (Q); blue dots and dotted markings refer to BLLs (B). Kendall’s τ correlation coefficient and significance are reported for FSRQs and BLLs. If a source has a BB95 fraction of zero, it is plotted in the top panels but not in the bottom ones. The running averages in the top row (shown as solid lines for FSRQs and dotted lines for BLLs) and the box plots in bottom row are both only calculated for at least ten nonzero values within each bin. In the top panels we show all data points, while in the bottom panels we zoom in on the boxes.
Current usage metrics show cumulative count of Article Views (full-text article views including HTML views, PDF and ePub downloads, according to the available data) and Abstracts Views on Vision4Press platform.
Data correspond to usage on the plateform after 2015. The current usage metrics is available 48-96 hours after online publication and is updated daily on week days.
Initial download of the metrics may take a while.