Fig. 3
Download original image
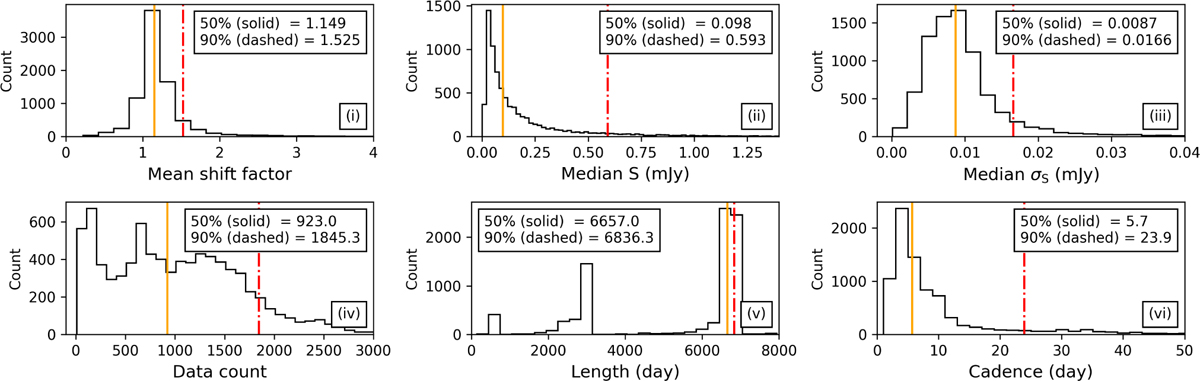
Global distributions of 8130 merged CAZ light curves (7722 of AGN and 408 of WDs) with ≥10 data points and ≥30 d duration. The panels are as follows: (i) mean shift factor across all filters per light curve. (ii) Median flux density per light curve. (iii) Median flux density error per light curve. (iv) Data count per light curve. (v) Length of each light curve. (vi) Cadence per light curve calculated by dividing the length of each light curve by its data count. The vertical solid orange line shows the median, and the dashed red line shows the 90th percentile.
Current usage metrics show cumulative count of Article Views (full-text article views including HTML views, PDF and ePub downloads, according to the available data) and Abstracts Views on Vision4Press platform.
Data correspond to usage on the plateform after 2015. The current usage metrics is available 48-96 hours after online publication and is updated daily on week days.
Initial download of the metrics may take a while.