Fig. 5
Download original image
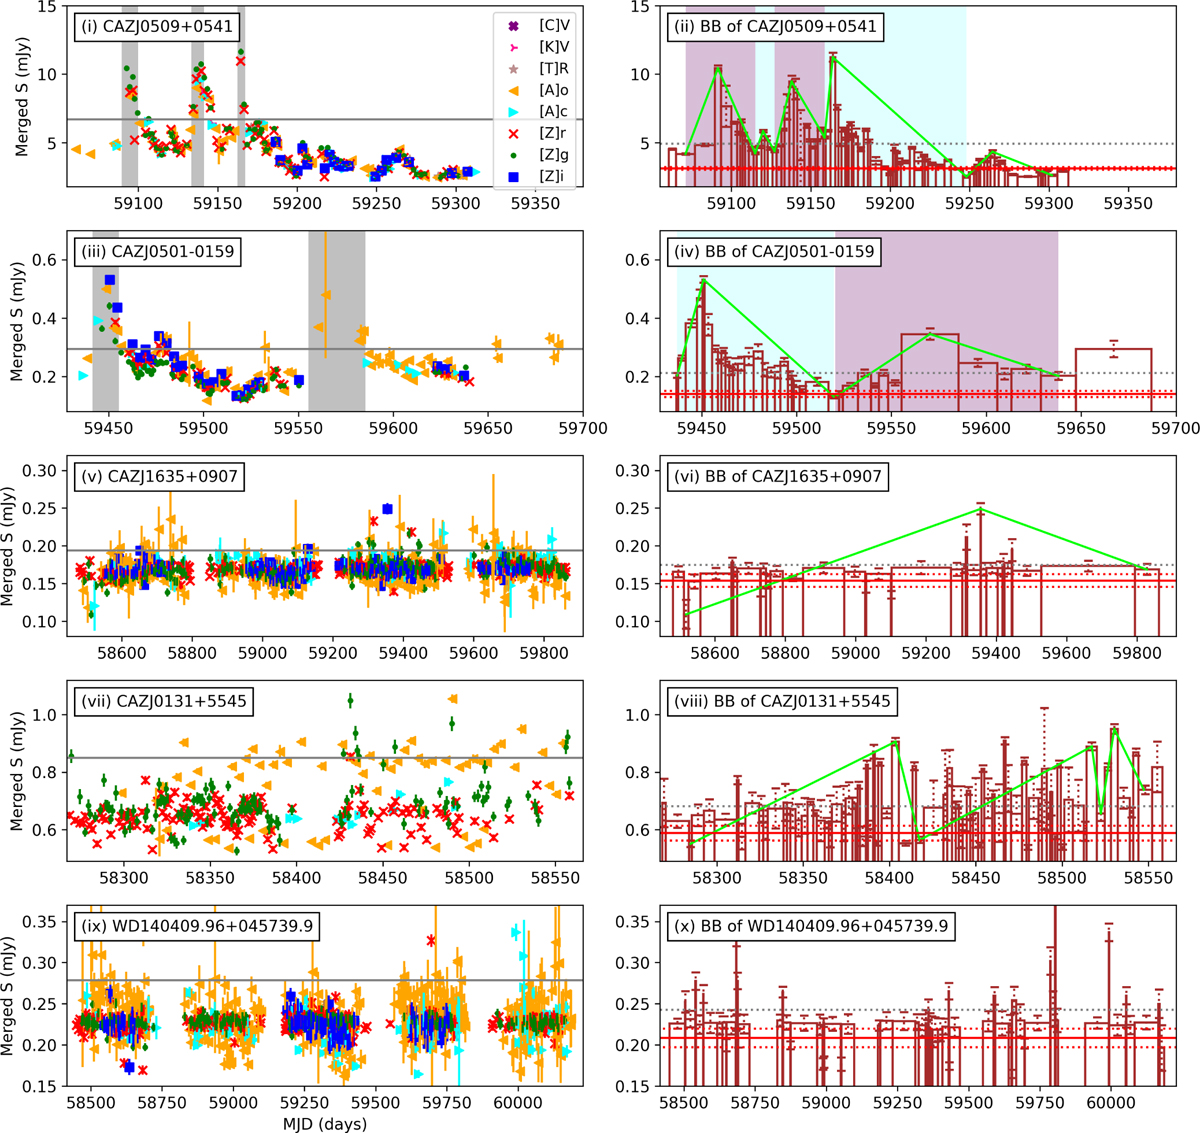
Example zoomed-in light curves with BB95 periods (Sect. 4.2) and BBHOP flares (Sect. 4.3) identified. The merged light curves on the left are zoomed-in versions of those shown in Fig. 4. The light curves on the right are their corresponding BB light curves. The gray vertical area on the left shows BB95 periods, which are BBs whose flux density is larger than S95% (shown as the gray horizontal line in the left). BBHOP flares are shown on the right using green lines, connecting their start to the peak and then to the end BB. Prominent BBHOP flares are further distinguished with a purple or cyan background. The horizontal solid red line in the right panels represents the reference flux density for determining the global amplitude 𝒢 (i.e., S25%; the dotted lines represent its error). The gray horizontal dotted line in the right plots represents S75%, which is needed when determining prominent BBHOP flares. We note that CAZJ1635+0907 and CAZJ0131+5545 were determined to be non-variable, and WD140409.96+045739.9 is non-variable by definition. Thus, we did not identify BB95 and prominent BBHOP flares in their light curves.
Current usage metrics show cumulative count of Article Views (full-text article views including HTML views, PDF and ePub downloads, according to the available data) and Abstracts Views on Vision4Press platform.
Data correspond to usage on the plateform after 2015. The current usage metrics is available 48-96 hours after online publication and is updated daily on week days.
Initial download of the metrics may take a while.