Fig. 6
Download original image
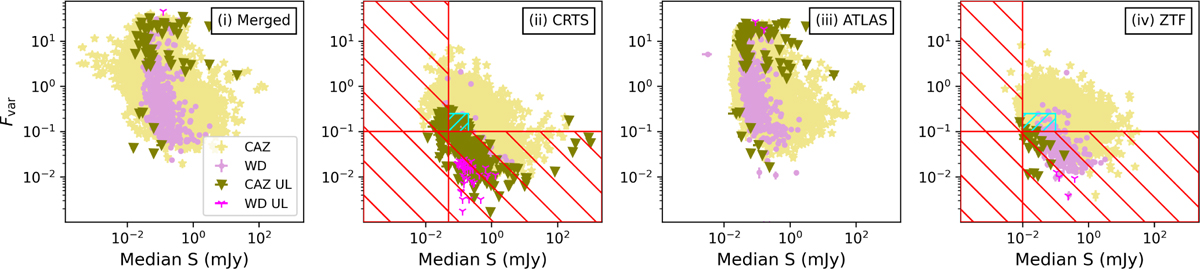
Fractional variability (Fvar) versus median flux density plots. The panels are as follows: (i) Merged light curves. (ii) CRTS only. (iii) ATLAS only. (iv) ZTF only. The term “UL” refers to 3σ upper limits of Fvar. The red hatched areas in (ii) and (iv) represent the low flux density and low variability regimes to determine non-variable light curves. The cyan hatched box is typically occupied by WDs and is another non-variable regime.
Current usage metrics show cumulative count of Article Views (full-text article views including HTML views, PDF and ePub downloads, according to the available data) and Abstracts Views on Vision4Press platform.
Data correspond to usage on the plateform after 2015. The current usage metrics is available 48-96 hours after online publication and is updated daily on week days.
Initial download of the metrics may take a while.