Fig. 8
Download original image
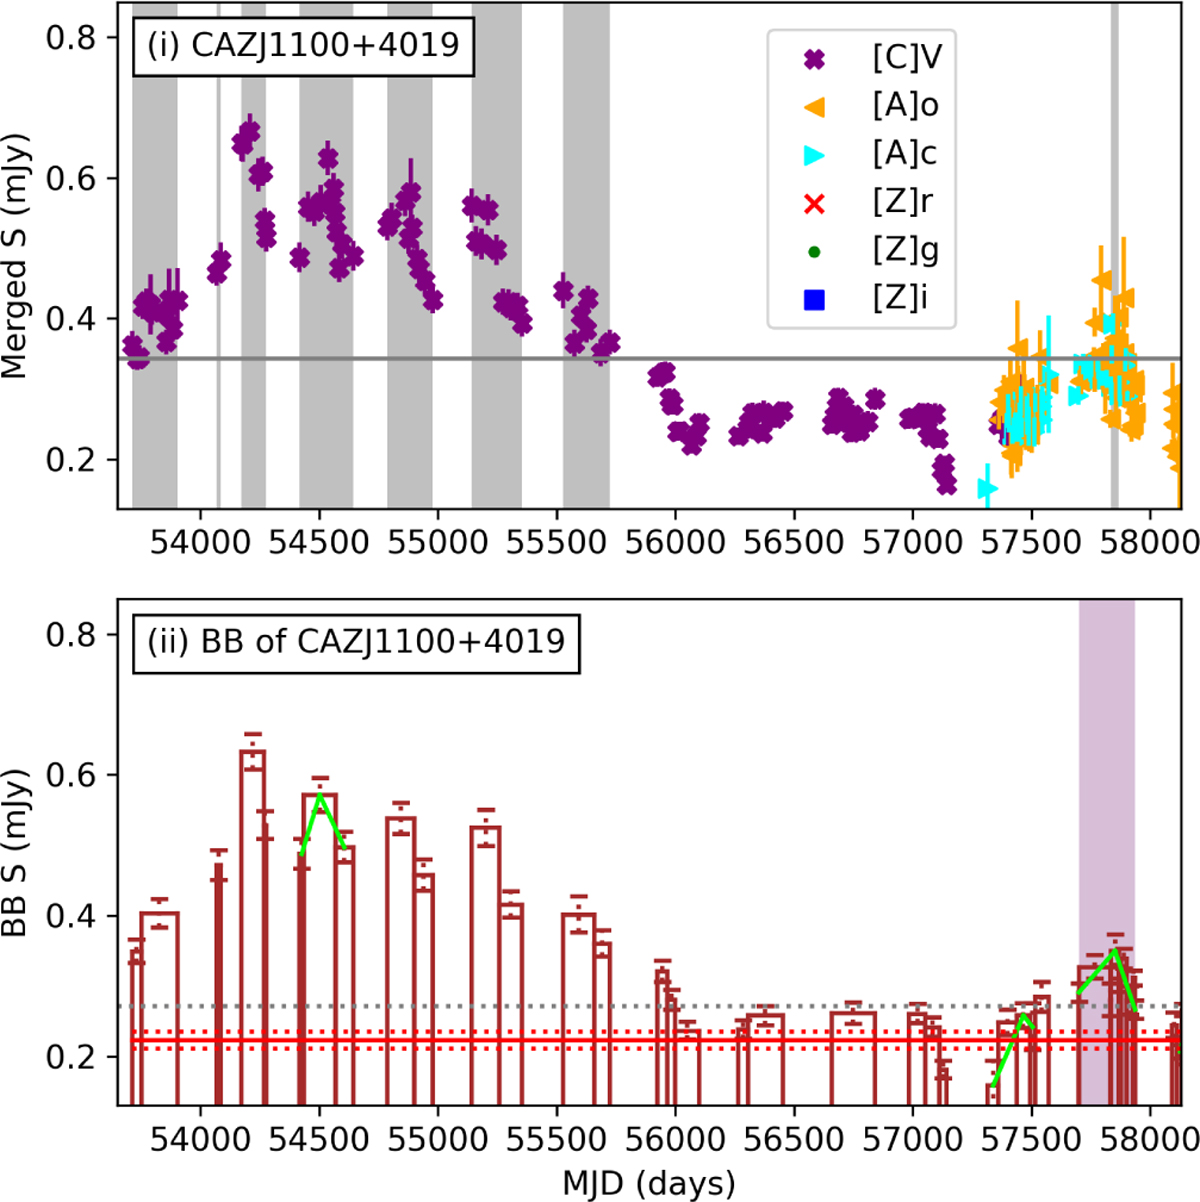
Difference between BB95 (gray vertical areas in panel i), BBHOP flares (green lines in panel ii), and prominent BBHOP flares (purple area along with green lines in panel ii). Panel i: merged CAZ light curve. Panel ii: BBs of the merged CAZ light curve for a zoomed-in portion of CAZJ1100+4019. The horizontal solid gray line represents S95%, the horizontal dotted gray line represents S75%, and the horizontal solid red line shows S25% (with its errors shown as dotted red lines). For more plot details, see the description of Fig. 5. The BBHOP algorithm fails to find flares in low cadence periods (e.g., CRTS-epoch) due to frequent observational gaps. Notably, unlike the BBHOP algorithm, the performance of the BB95 algorithm on periods with data is not affected by the presence of neighboring observational gaps.
Current usage metrics show cumulative count of Article Views (full-text article views including HTML views, PDF and ePub downloads, according to the available data) and Abstracts Views on Vision4Press platform.
Data correspond to usage on the plateform after 2015. The current usage metrics is available 48-96 hours after online publication and is updated daily on week days.
Initial download of the metrics may take a while.