Fig. 3.
Download original image
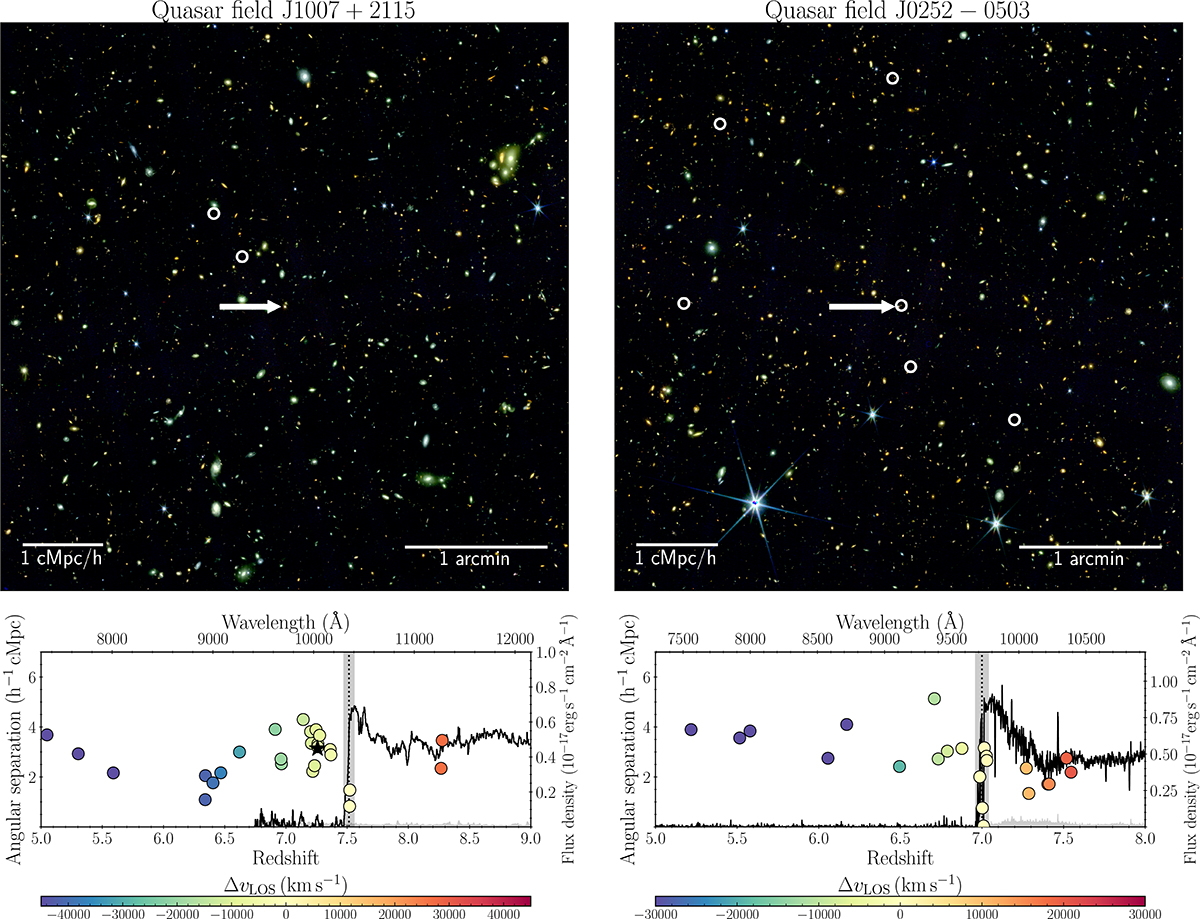
Top panels: JWST NIRCam composite image (R: F444W, G: F277W, B: F115W) of the J1007+2115 (left) and J0252−0503 (right) quasar fields. The quasar position is indicated by the tip of the white arrow. The positions of galaxies within a line-of-sight velocity window of ‖ΔvLOS‖ = 1500 km s−1 are indicated by white circles. Bottom panels: Optical to near-infrared spectra (solid black lines) of the two quasars J1007+2115 (left) and J0252−0503 (right) taken from Onorato et al. (2025) with their wavelength and flux density axes on the top and right. We highlight the relative angular separation and redshift (left and bottom axes) of the galaxies identified in each respective field with filled colored circles. The quasar redshift (dotted line), coinciding with the Lyman-break in the spectrum, centers the line-of-sight velocity window used in our clustering analysis (gray shaded region). The color-coding of the circles refers to the galaxies’ line-of-sight velocity relative to the quasar redshift. The black star in the bottom left panel marks the position of a serendipitously discovered z ≈ 7.3 LRD (Schindler et al. 2025).
Current usage metrics show cumulative count of Article Views (full-text article views including HTML views, PDF and ePub downloads, according to the available data) and Abstracts Views on Vision4Press platform.
Data correspond to usage on the plateform after 2015. The current usage metrics is available 48-96 hours after online publication and is updated daily on week days.
Initial download of the metrics may take a while.