Fig. 2
Download original image
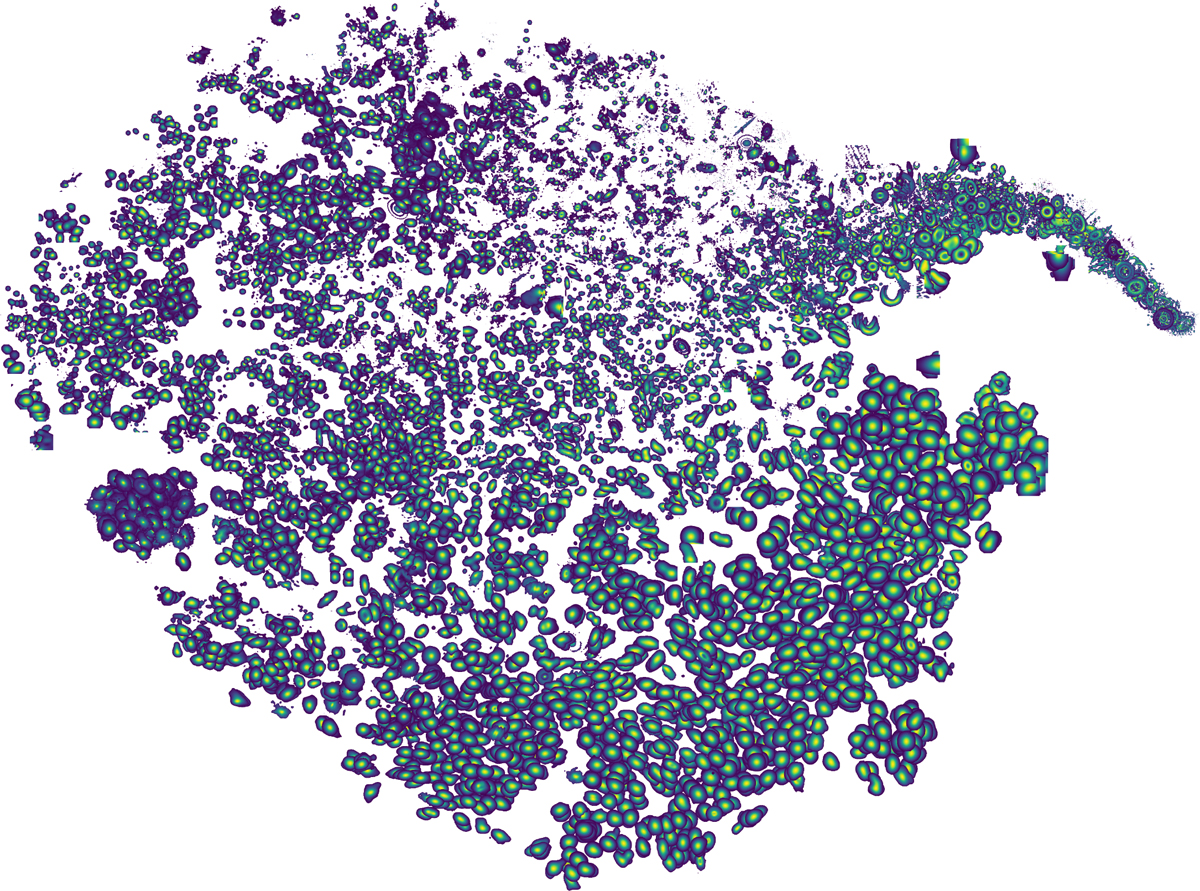
t-SNE projection of embedding vectors for ALMA continuum images selected from the ASA. Each point is represented by a thumbnail of the corresponding FITS image. For clarity, low-emission regions have been masked using an adaptive threshold derived from a Gaussian fit to the core of the distribution of normalized pixel values. Sources with stronger emission appear overplotted on weaker ones in the plot to enhance visibility.
Current usage metrics show cumulative count of Article Views (full-text article views including HTML views, PDF and ePub downloads, according to the available data) and Abstracts Views on Vision4Press platform.
Data correspond to usage on the plateform after 2015. The current usage metrics is available 48-96 hours after online publication and is updated daily on week days.
Initial download of the metrics may take a while.