Fig. 6.
Download original image
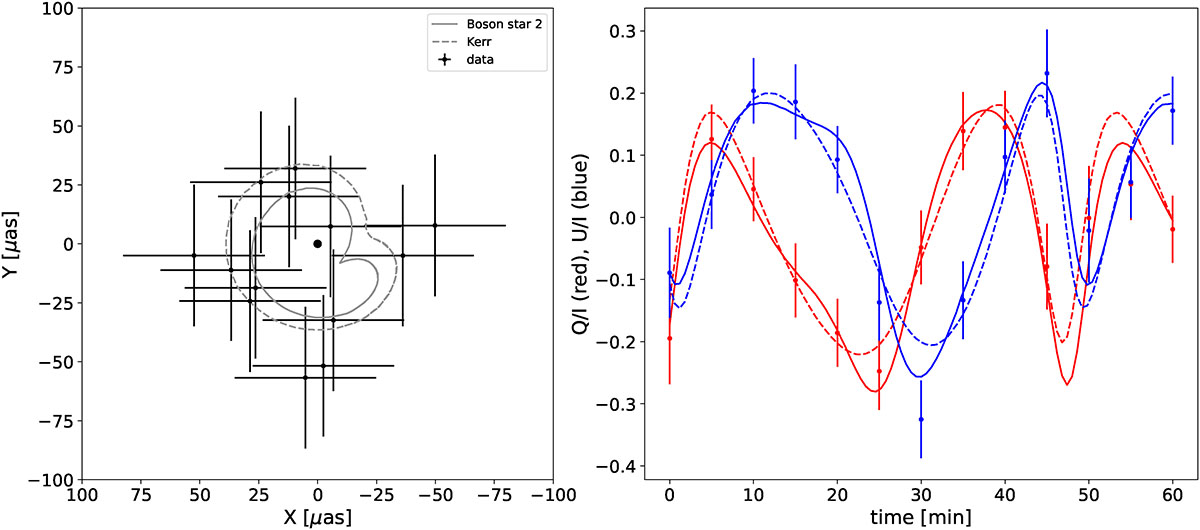
Simulated data, generated in the boson star 2 metric and represented by dots with error bars (reflecting GRAVITY-like uncertainties), compared with two best-fit models: one model in the boson star 2 metric (solid line), and the other in the Kerr metric (dashed lines). Left: astrometry. Right: time evolution of Q/I in red and U/I in blue.
Current usage metrics show cumulative count of Article Views (full-text article views including HTML views, PDF and ePub downloads, according to the available data) and Abstracts Views on Vision4Press platform.
Data correspond to usage on the plateform after 2015. The current usage metrics is available 48-96 hours after online publication and is updated daily on week days.
Initial download of the metrics may take a while.