Fig. 7
Download original image
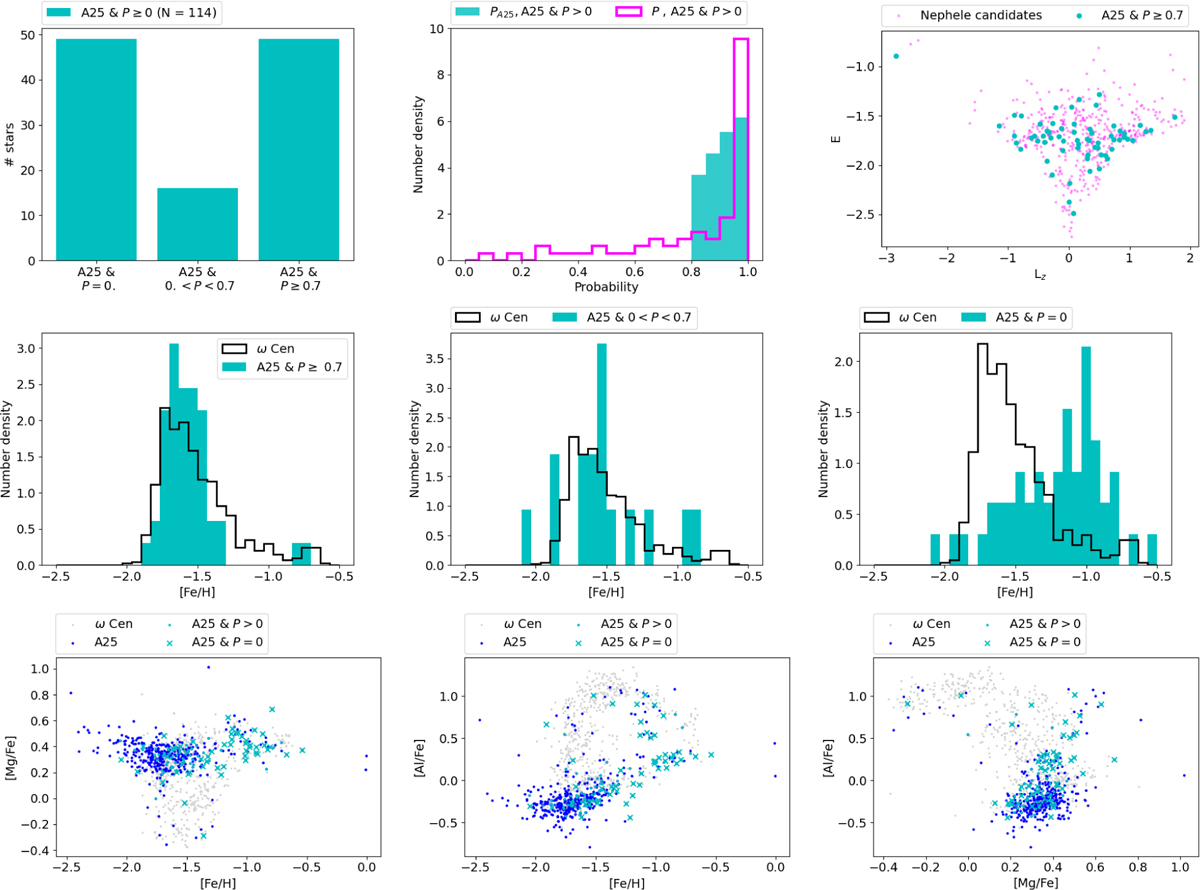
Comparison with stars in Anguiano et al. (2025) (A25). Top row, left panel: number of stars in the A25 sample that, according to our analysis, have a null (P = 0), not null (0 < P < 0.7) or high (P ≥ 0.7) probability of being chemically compatible with ω Cen. Top row, middle panel: distribution of probabilities P (magenta) of the stars of A25’s sample which, according to our analysis, have a not null probability of being chemically compatible with ω Cen, compared to the analogue distribution of probabilities PA25 (cyan) provided by A25. It can be noted that part of the stars which have a high PA25 turns out to have a low P, according to our GMMChem model. Top row, right panel: distribution in the E-Lz plane of Nephele candidate members (P ≥ 0.7, magenta), compared to that of stars in A25 (cyan) which have also a high P, according to our analysis, of belonging to Nephele. Middle row, left panel: normalised [Fe/H] distribution of A25's stars which are classified as Nephele candidate members (P ≥ 0.7) also by our GMMChem model (cyan). For comparison, the normalised [Fe/H] distribution of ω Cen stars is also shown. Middle row, middle panel: same for A25's stars which have a moderate probability (0 < P < 0.7) of being chemically compatible with ω Cen, according to our GMMChem model. For comparison, the normalised [Fe/H] distribution of ω Cen stars is also shown. Middle row, right panel: same for A25's stars which have a null probability P of being chemically compatible with ω Cen, according to our GMMChem model. For comparison, the normalised [Fe/H] distribution of ω Cen stars is also shown. Bottom row, left panel: distribution in the [Mg/Fe] vs [Fe/H] plane of stars in the A25's sample. Blue points indicate A25's stars which have not been analysed in our work, cyan points indicate A25's stars for which a probability P has been assigned by our GMMChem model. Cyan crosses indicate A25's stars which have a P = 0, according to our GMMChem model. The corresponding distribution of ω Cen stars in this plane is also shown (light grey points). Bottom row, middle panel: same for [Al/Fe] vs [Fe/H]. Bottom row, right panel: same for [Al/Fe] vs [Mg/Fe].
Current usage metrics show cumulative count of Article Views (full-text article views including HTML views, PDF and ePub downloads, according to the available data) and Abstracts Views on Vision4Press platform.
Data correspond to usage on the plateform after 2015. The current usage metrics is available 48-96 hours after online publication and is updated daily on week days.
Initial download of the metrics may take a while.