Fig. 1
Download original image
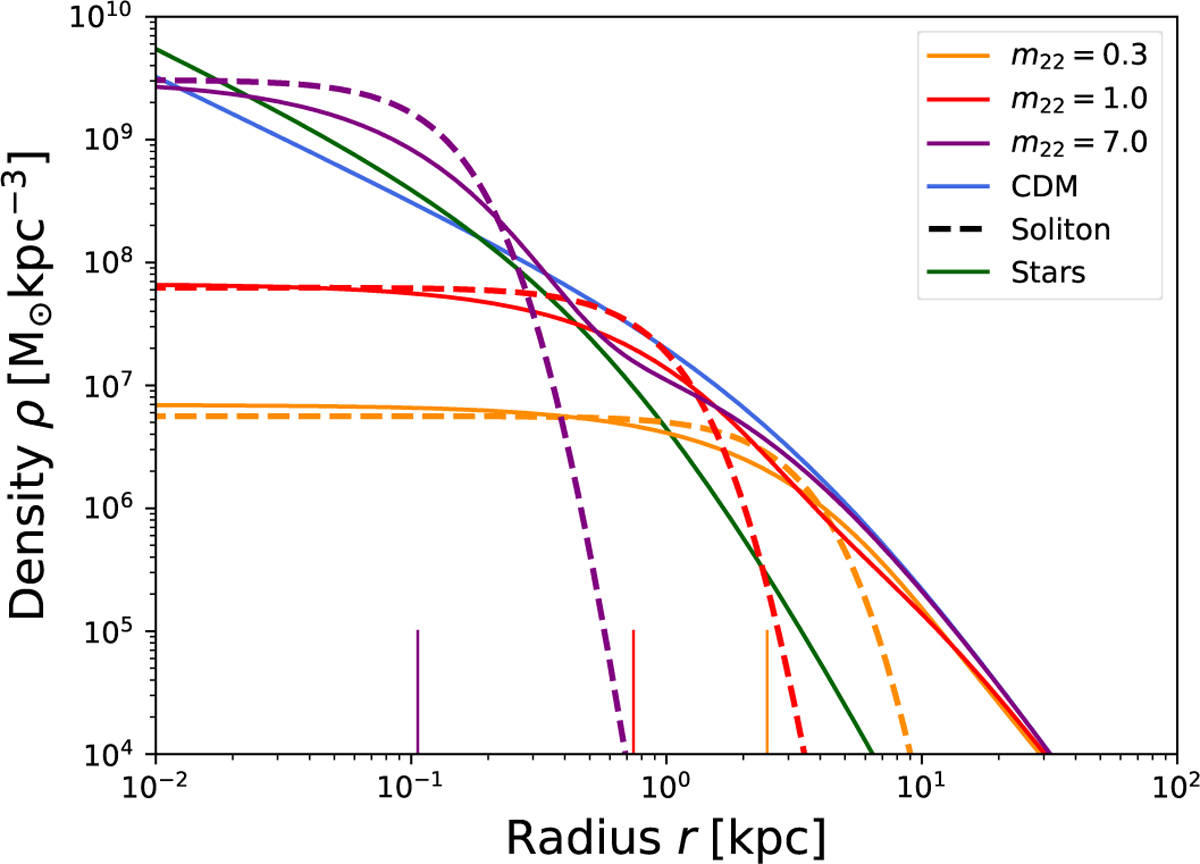
DM profiles of a 1010 M⊙ halo at z = 0 for different values of m22 as in Safarzadeh & Spergel (2020). The dashed lines show the central solitonic profiles. The blue line shows the NFW profile of a 1010 M⊙ halo at z = 0. The solid lines show our model for the full halo profile, which is a combination of the FDM profile transitioning to an NFW profile, described by Equations (12) and (13). The vertical lines indicate the size of the FDM core radius. The green solid line corresponds to the typical stellar density profile for this halo mass, extracted from the TNG50.
Current usage metrics show cumulative count of Article Views (full-text article views including HTML views, PDF and ePub downloads, according to the available data) and Abstracts Views on Vision4Press platform.
Data correspond to usage on the plateform after 2015. The current usage metrics is available 48-96 hours after online publication and is updated daily on week days.
Initial download of the metrics may take a while.