Fig. 3
Download original image
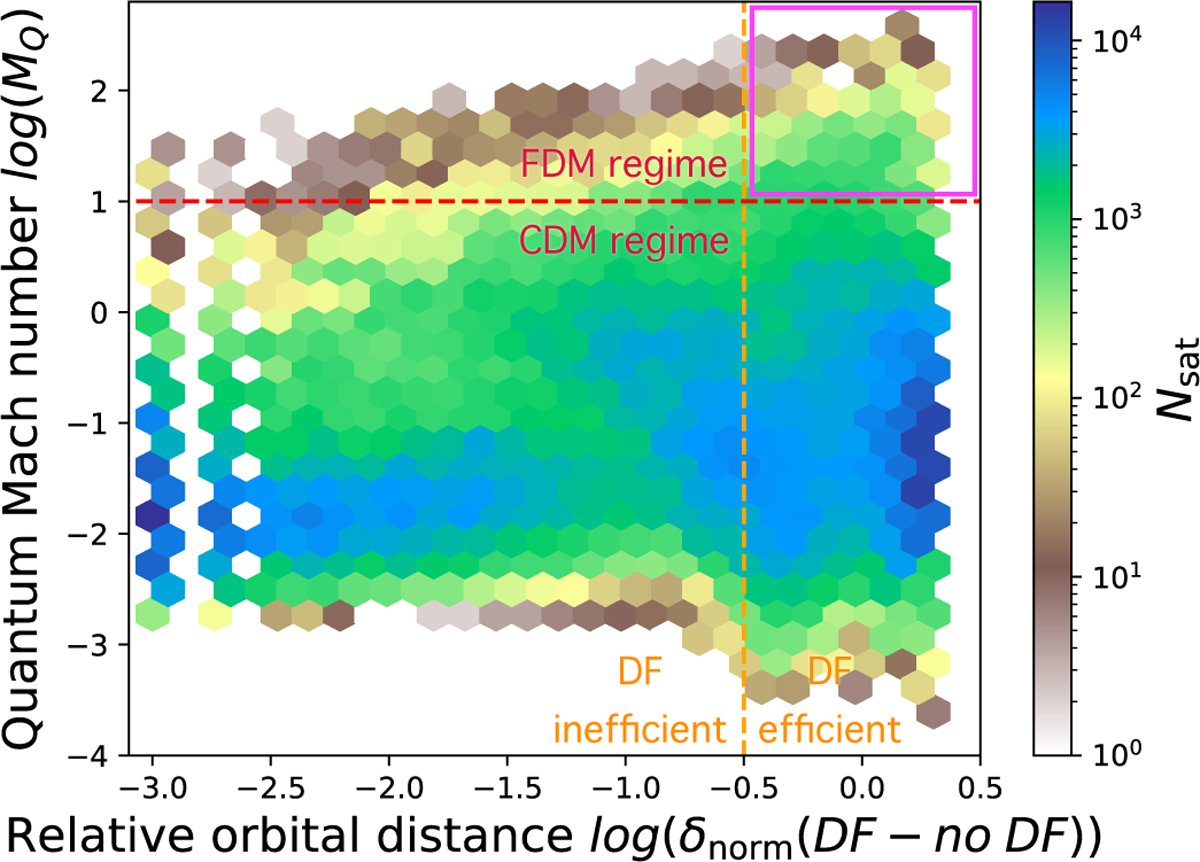
Dynamical friction of merged satellites: quantum Mach number as a function of the relative orbital distance for all merged satellites in the entire TNG50 sample between z = 2 and z = 0 for m22 = 0.3. The hexagonal bins represent regions containing at least one satellite. The red dashed line shows the adopted boundary between the FDM and CDM regimes, based on the quantum Mach number defined in Equation (9). The orange dashed line indicates the threshold where DM dynamical friction becomes efficient, as defined in Equation (14). The magenta box highlights the region of interest where FDM dynamical friction must be taken into account, but this only concerns 1.8% of the satellites.
Current usage metrics show cumulative count of Article Views (full-text article views including HTML views, PDF and ePub downloads, according to the available data) and Abstracts Views on Vision4Press platform.
Data correspond to usage on the plateform after 2015. The current usage metrics is available 48-96 hours after online publication and is updated daily on week days.
Initial download of the metrics may take a while.